3.05 Rain on Soil, Grass and Pavement
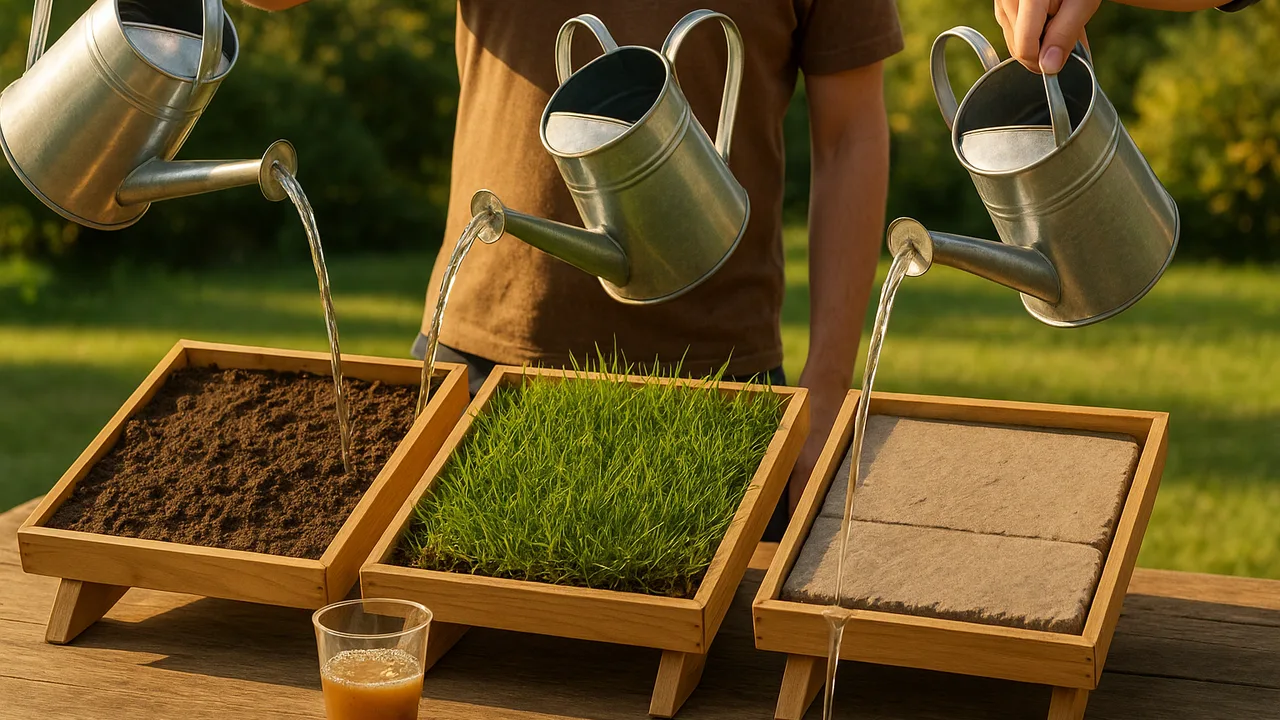
measure how much rainwater runs off soil, grass and a hard surface, and explain how the land changes where the water goes.
- I can describe how the parts of the two Earth systems in my model interact with each other in my example.
- I can use my model to explain different ways the two Earth systems in my example work together to change Earth’s surface.
- I can use my model to show how parts of one Earth system help that system work and also help the other system work.
- I can list the features that a solution must have to solve the problem.
Phase 2: Investigate
Warm-Up ~5 min
Do Now. Think about a big parking lot during a thunderstorm. Now think about a soccer field in the same storm. Where does the rain go in each place?
We pour the same amount of “rain” on three trays: bare soil, grass and a hard plastic “pavement.” Which tray will send the MOST water running off the end?
Instruction ~10 min
Creek guardians, let’s make it rain. Every surface in our watershed meets the rain differently. Today you measure what each one does with the water.
The setup. Each team has three trays, tilted on one book. Tray A has bare damp soil. Tray B has soil with grass or sprouts. Tray C is a plastic lid or cookie sheet, standing in for pavement. A cup at the low end catches runoff. Pour 250 mL of water slowly from a cup with holes, like rain.
Worked example 1: measuring runoff. Malik’s team pours 250 mL on Tray C. They pour the runoff cup into a measuring cup. It holds 230 mL. They write 230 mL in the table. Then they rate how muddy it looks, from 1 (clear) to 5 (very muddy).
Worked example 2: finding the missing water. On Tray A, Mei’s team catches only 90 mL. Where did the rest go? She presses the soil. It is soaked. Most of the water sank into the ground. She also sees a small channel where water cut through the soil.
Thinking about our client. Look at your three trays like a map of our town. Where would most runoff reach the creek fastest? Add one criterion to our list: what must the plan do about runoff?
Guided Exercises ~15 min
Run all three tests. Pour 250 mL each time, from the same height. The Recorder fills in this table.
| Tray | Surface | Water poured (mL) | Runoff caught (mL) | Water that soaked in (mL) | Mud rating (1–5) | Changes to the surface |
|---|---|---|---|---|---|---|
| A | Bare soil | 250 | ||||
| B | Grass or sprouts | 250 | ||||
| C | Hard pavement | 250 |
Water that soaked in = water poured − runoff caught. Then answer the questions with your team.
Independent Practice ~10 min
Use your data to think about the town.
Write two sentences: one about how water changed the land on a tray, and one about how the land changed what the water did.
Add a criterion to our list: what must the creek plan do about runoff? Give a reason from your data.
Closure ~5 min
Land and water acted on each other on every tray. Next, we look for hidden water in the air and in living plants.
Exit ticket: which surface sent the most runoff toward the “creek”? Give your number and explain why.
Teacher notes
Materials (per team): three trays or aluminum pans (one can be a plastic lid or cookie sheet), about 3 cups of damp soil, a square of sod or seeds sprouted 5–7 days ahead, one book, a paper cup with 8–10 small holes poked in the bottom, a 250 mL measuring cup, a runoff cup, paper towels.
Setup: Cut a small notch at the low end of each tray so runoff pours into the cup. Pre-moisten the soil. Cover tables.
Listen for: “The soil drank the water.” Ask where the water is now; let students dig a finger in. Runoff amounts will vary by team; that is fine as long as the pattern holds.
Support / stretch: Pre-fill the subtraction for teams that need it. Stretch: add a tray with gravel over soil, like a gravel driveway.