4.06 Wave or Particle? Interference Evidence, CER and Ideate
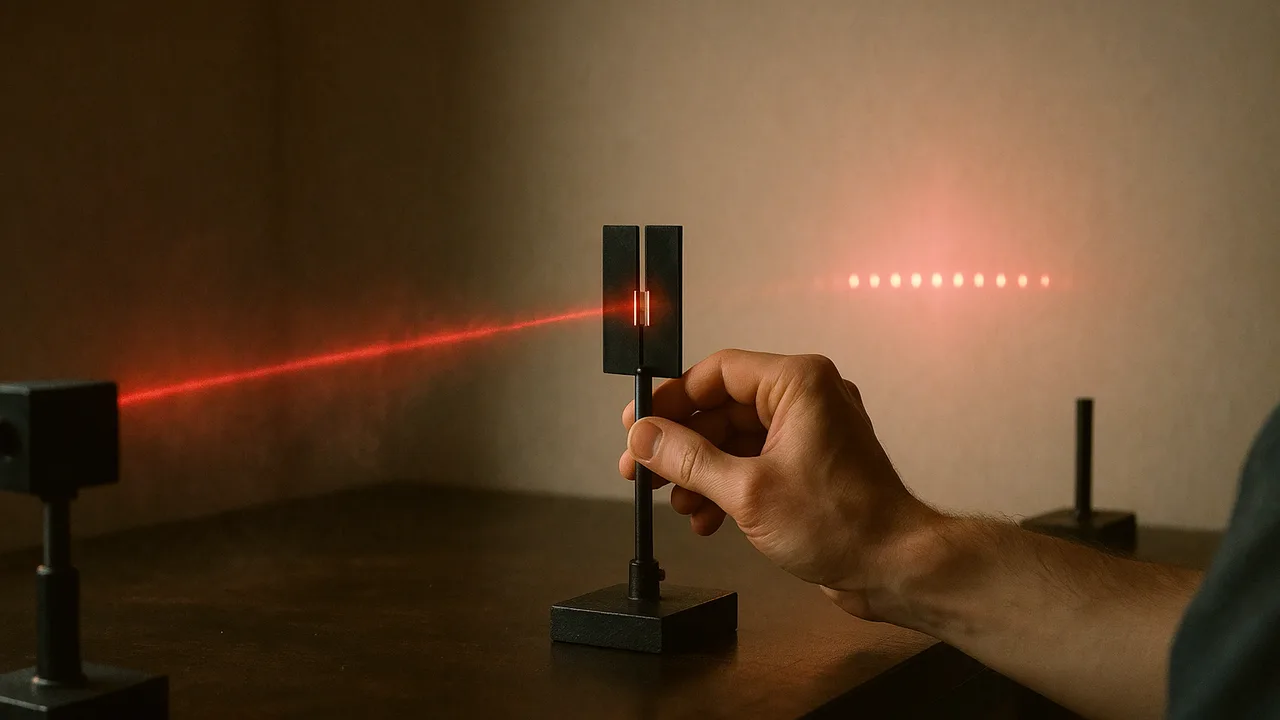
measure an interference pattern to find the wavelength of light, analyze photoelectric data, write a CER that evaluates the wave and particle models, and brainstorm designs for our backup alert link.
- I can identify evidence related to interference behavior of electromagnetic radiation.
- I can identify evidence related to the photoelectric effect.
- I can analyze evidence for interference behavior of electromagnetic radiation to explain how it supports the wave model.
- I can evaluate claims and reasoning for using both wave and particle models to describe electromagnetic radiation.
- I can explain why the wave model is more useful for some aspects of energy and information transfer, and the particle model is more useful for others.
Phase 3: Make Sense
Warm-Up ~5 min
Do Now. Tilt a CD or DVD under a lamp and describe the colors. Where do you think they come from? The disc has no dyes.
Two beams of light can add up to darkness at some points on a screen.
Instruction ~10 min
Interference: the wave evidence. In the early 1800s Thomas Young passed light through two narrow slits and saw a row of bright and dark bands, not two bright lines. Light from the two slits travels slightly different distances to each point on the screen. Where the path difference is a whole number of wavelengths, crests meet crests and the waves add: a bright band. Where it is a half-wavelength off, crests meet troughs and cancel: a dark band. Particles flying in straight lines cannot cancel each other, so the dark bands are the key evidence.
A diffraction grating has hundreds of evenly spaced slits per millimeter. Bright spots appear at angles where d sin θ = mλ, with d the slit spacing and m = 0, 1, 2… A CD’s tracks, about 1.6 μm apart, act like a grating, which is why it shows colors.
Worked example 1: measuring a wavelength. A grating with 500 lines per mm has d = 1/500 mm = 2.0 × 10⁻⁶ m. A red laser spot shines on a wall 1.00 m away; the first-order spots sit 0.344 m either side of the center. tan θ = 0.344/1.00, so θ = 19.0°, and λ = d sin θ = (2.0 × 10⁻⁶)(0.325) = 6.5 × 10⁻⁷ m = 650 nm (illustrative measurement). A green 532 nm laser gives spots at 0.276 m: shorter wavelength, smaller angle.
Photoelectric evidence: the particle side (constructed sample data). Light of five wavelengths shines on a metal with a work function of about 2.3 eV. The stopping voltage is the reverse voltage that just stops the fastest electrons, so it measures their maximum kinetic energy in eV.
| λ (nm) | f (1014 Hz) | Photon energy (eV) | Stopping voltage (V) | Current at double brightness |
|---|---|---|---|---|
| 365 | 8.22 | 3.40 | 1.10 | doubles; stopping voltage unchanged |
| 405 | 7.41 | 3.06 | 0.76 | doubles; unchanged |
| 436 | 6.88 | 2.85 | 0.55 | doubles; unchanged |
| 546 | 5.49 | 2.27 | 0 (no electrons) | still zero |
| 578 | 5.19 | 2.15 | 0 (no electrons) | still zero |
Plot stopping voltage against frequency for the three rows with electrons: the points lie on a straight line with slope 4.13 × 10⁻¹⁵ V·s, which is h/e. The line crosses zero near 5.6 × 10¹⁴ Hz, the threshold frequency. A wave model predicts that brighter light of any color should eventually free electrons, and that brighter light should make faster ones. Neither happens: brightness changes only how many electrons come out.
Worked example 2: a CER on the two models. Claim: light behaves as a wave when it travels and spreads, and as a stream of photons when it is absorbed or emitted. Evidence: dark bands in the grating pattern (cancellation); a threshold frequency of about 5.6 × 10¹⁴ Hz and stopping voltages that depend on frequency but not brightness. Reasoning: only waves can cancel; only energy delivered in packets of hf explains a threshold that brightness cannot beat. So the wave model is more useful for designing fibers, lenses and antennas, and the photon model for designing solar cells, light sensors and cameras.
Ideate for the backup alert link. Our link will send bits with a wave and detect them with a sensor. Brainstorm at least six designs before judging any: a flashlight or LED blinking to a phone light-sensor app or a small solar cell (photons free electrons in the detector); an infrared LED to a phototransistor; sound tones to a phone microphone and spectrum app; an LED sending light down a clear acrylic rod or a curved water-filled tube (total internal reflection); a shaded tube or hood to block room light; two colors of LED for 1 and 0. For each, note the wave behavior or photon interaction it relies on.
Guided Exercises ~15 min
Use the worked examples and the sample table.
Independent Practice ~10 min
Write the CER, then run the Ideate round with your team.
CER: Should light be modeled as a wave or as particles? Use your grating measurement (or the worked example) and the photoelectric table as evidence. Explain which model is more useful for designing a fiber link and which for designing a solar-cell receiver, and why.
Ideate: list at least six designs for the backup alert link. For each, name the wave behavior or photon interaction it uses, one strength and one risk against our criteria. Star the three you want to prototype.
Closure ~5 min
Light is both: waves for travel, photons for exchange with matter. Next phase: build the link.
Exit ticket: name one piece of wave evidence and one piece of particle evidence for light, and the reasoning that links each to its model.
How confident are you that you can I can use interference and photoelectric evidence to evaluate wave and particle models of light.
Teacher notes
Materials: 500 line/mm gratings (or old CDs), class 2 red and green laser pointers kept by the teacher, meter sticks, goggles. Reading: OpenStax College Physics 2e, chapters 27 and 29 (CC BY 4.0).
Setup: grating measurement 15 min, data analysis 10 min, CER 15 min, Ideate 10 min. The photoelectric table is constructed sample data built from E = hf and a 2.3 eV work function; no lab here measures it.
Listen for: “the wave model was proved wrong”; brightness confused with frequency; tan and sin mixed up.
Support / stretch: give a graph grid for stopping voltage against frequency. Stretch: estimate h from the slope of the sample data.