1.05 Power and a Pumped-Storage Day: A Computational Energy Model
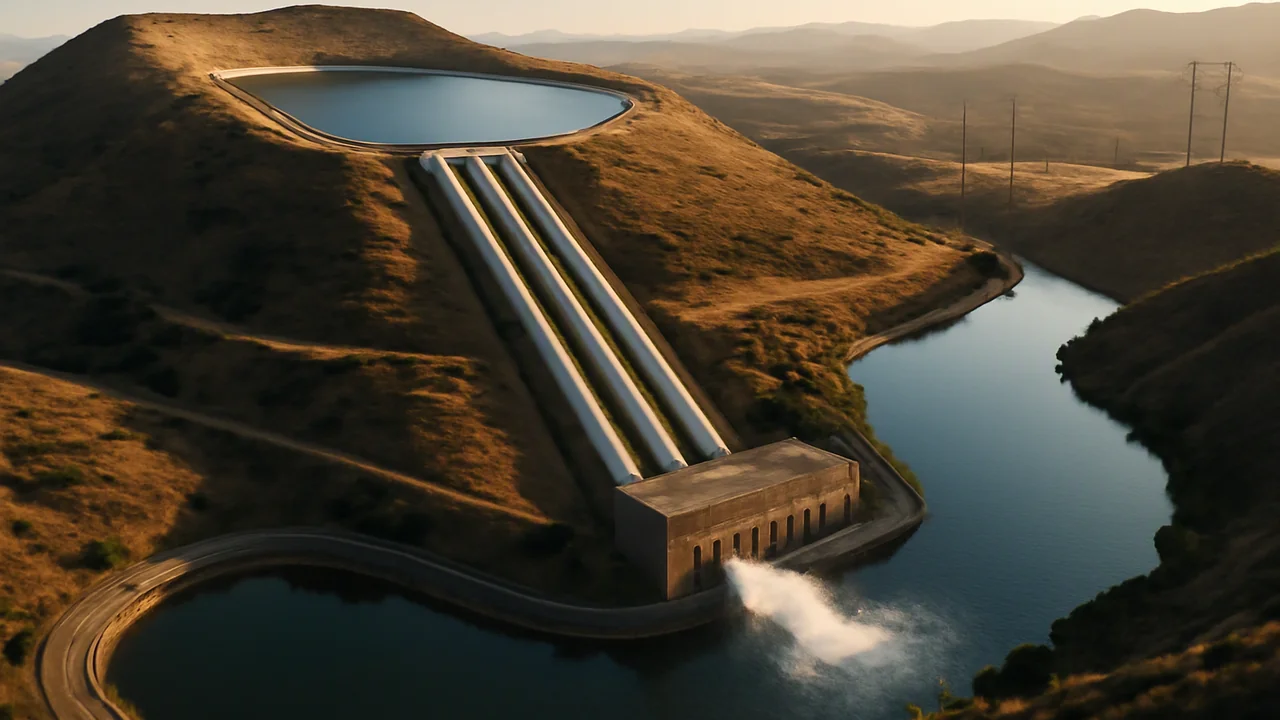
calculate power in several ways, convert between joules, kilowatt-hours and megawatt-hours, and build a spreadsheet model that tracks energy through a pumped-storage day and a skate track with friction.
- I can use algebraic descriptions of initial and final energy states, along with energy flows, to create a computational model based on the principle of conservation of energy.
- I can use a computational model to predict the maximum possible change in the energy of one component in a system for a given set of energy flows.
- I can identify and describe the limitations of a computational model based on the assumptions made in the algebraic descriptions of energy changes and flows.
Phase 3: Make Sense
Warm-Up ~5 min
Do Now. Use your stair data from the try-at-home task (or a 55 kg climber, 3.2 m, 4.0 s walking and 2.0 s running). Did walking and running change the energy gained? What did change?
Running up the stairs gives you more gravitational potential energy than walking up them.
Instruction ~10 min
Power is the rate of energy transfer. Two cranes can lift the same load to the same height; the one that does it faster has more power: P = W/t = ΔE/t, measured in watts (1 W = 1 J/s). When a force F pushes something along at steady speed v, P = Fv.
- A 55 kg student runs up a 3.2 m flight of stairs in 4.0 s: P = mgh/t = (55)(9.8)(3.2)/4.0 = 431 W, a little over half a horsepower (1 hp ≈ 746 W).
- An 800 kg elevator rising at a steady 2.0 m/s needs P = Fv = mgv = 15,680 W. Check: lifting it 30 m in 15 s gives mgh/t = 15,680 W, the same.
- A car at 25 m/s pushing against 500 N of air drag and rolling resistance needs 12.5 kW just to keep its speed.
Energy units at grid scale. The grid measures energy in kilowatt-hours: 1 kWh = (1000 J/s)(3600 s) = 3.6 × 10⁶ J, and 1 MWh = 3.6 × 10⁹ J. Power plants are rated in megawatts (MW); the energy they deliver is power times time.
A computational model of a pumped-storage day (illustrative numbers). A plant pumps at 300 MW from 10:00 to 16:00, when solar output is high, and generates from 18:00 to 22:00, when demand peaks. Pump efficiency 87%, generator efficiency 86%, head 500 m.
- Electricity used: 300 MW × 6 h = 1,800 MWh.
- Stored as gravitational potential energy: 1,800 × 0.87 = 1,566 MWh.
- Delivered in the evening: 1,566 × 0.86 = 1,346.8 MWh, an average of 336.7 MW over 4 h. Round trip: 74.8%.
- Water moved: m = E/(gh) = (1,566 × 3.6 × 109 J)/((9.8)(500)) = 1.15 × 10⁹ kg, about 1.15 million m3.
A spreadsheet runs this hour by hour: column A the hour, B the mode (pump, idle, generate), C the electrical power, D the energy stored at the end of the hour (the previous value plus pumping × efficiency, or minus generation ÷ efficiency). The graph shows the result:
Once the model works, you can change one input and watch the output: a higher head stores the same energy in less water; better turbines raise the round trip. That is what makes it a computational model.
Energy accounting with friction. The same bookkeeping works for a skateboarder (60 kg) on a track with a steady 30 N of friction along it (illustrative numbers). At every point, PE + KE + thermal = the starting 2,940 J, where thermal = friction × distance traveled along the track:
| Point | Height (m) | Track distance from start (m) | PE (J) | Thermal (J) | KE (J) | Speed (m/s) |
|---|---|---|---|---|---|---|
| A (start) | 5.0 | 0 | 2,940 | 0 | 0 | 0.00 |
| B (bottom) | 0.0 | 8 | 0 | 240 | 2,700 | 9.49 |
| C (hump) | 2.0 | 12 | 1,176 | 360 | 1,404 | 6.84 |
| D (end) | 0.5 | 17 | 294 | 510 | 2,136 | 8.44 |
At B, KE = 2,940 − 0 − 240 = 2,700 J, so v = √(2 × 2,700/60) = 9.49 m/s, compared with 9.90 m/s without friction. The total never changes; the thermal column only grows.
Common errors. Mixing kW and kWh (power versus energy); forgetting to convert hours to seconds; applying an efficiency twice or in the wrong direction (pumping multiplies by efficiency, drawing stored energy back out divides by it when you ask how much must be stored to deliver a given amount).
Guided Exercises ~15 min
Build the model first, then test it with changed inputs.
Independent Practice ~10 min
Extend the computational model.
Build the pumped-storage spreadsheet from the lesson. Then test two proposed improvements: (a) raising the head from 500 m to 600 m, and (b) better turbines with 90% generator efficiency. For each, report the round-trip efficiency and the volume of water needed. Which change helps the grid more, and which helps the reservoir size? Paste your table and graph (a calculator table is fine).
Use your model to predict the MAXIMUM energy the plant could deliver in an evening if pumping ran 8 hours instead of 6. Then list two assumptions in your model that a real plant might break.
Closure ~5 min
A computational model lets you change one input and predict the output, and its assumptions tell you how far to trust it.
Exit ticket: explain the difference between 300 MW and 300 MWh in one sentence each, with an everyday example.
How confident are you that you can I can calculate power and build a spreadsheet model that tracks energy through a system.
Teacher notes
Materials: spreadsheet software or graphing calculators; the skate-park sim on devices, or the printed skate-track table.
Timing: Poly ran this workshop over two 50-minute periods. In one period, give a pre-built spreadsheet shell, or let this lesson span two periods.
Listen for: kW and kWh used as the same thing; hours not converted to seconds; efficiency applied twice.
Support / stretch: provide column headers and the first two rows. Stretch: add a column for water volume in the upper reservoir and graph it.