3.07 Design and Prototype: Competing Links and a Decision Matrix
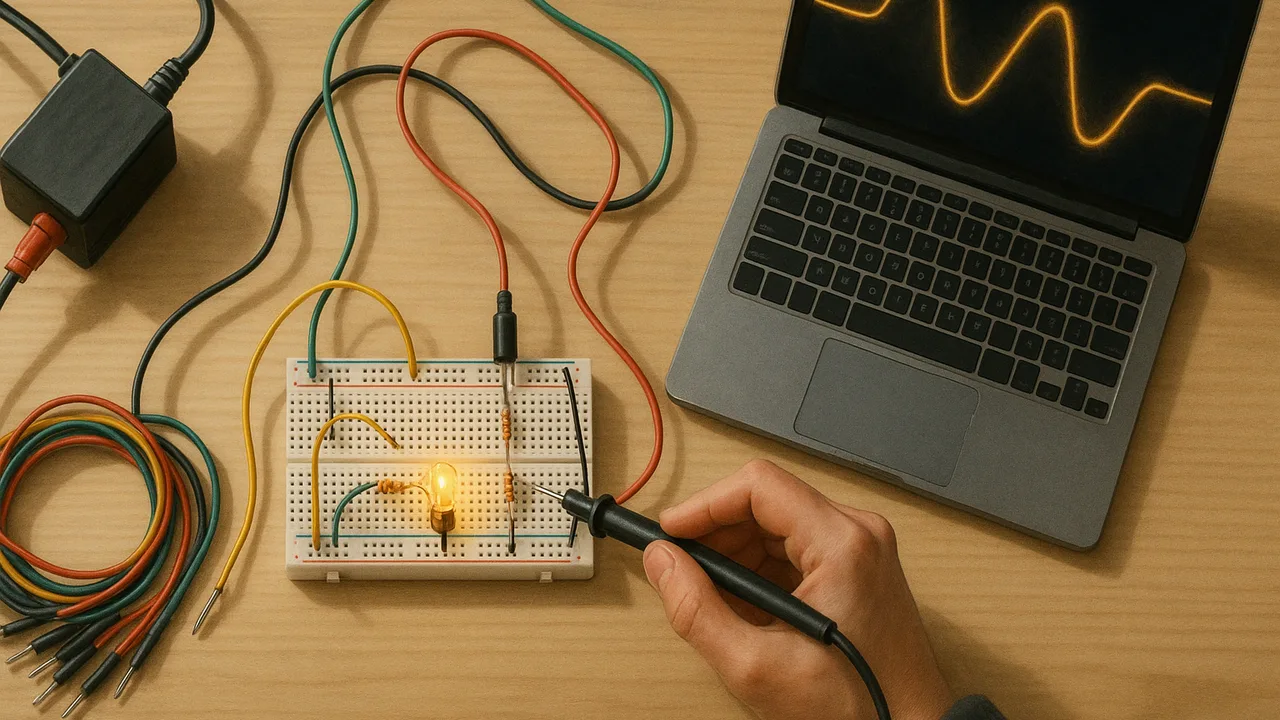
turn our brainstormed ideas into competing transmission designs, test each in a circuit simulation with realistic inputs, compare the results with our predictions, and rank the designs in a weighted decision matrix.
- I can identify the complex real-world problem being modeled in a computer simulation, including its criteria and constraints.
- I can describe the system being modeled, including its boundaries.
- I can identify which variables I can change in the simulation and explain the scientific principles or relationships the model uses.
- I can select logical and realistic inputs when using a computer simulation.
- I can use the simulation to test the effects of different solutions, tradeoffs, or decisions.
- I can compare the results from the simulation to what I expected would happen.
Phase 4: Build
Warm-Up ~5 min
Do Now. From your Ideate list, pick the idea you think will deliver the most energy to town and the idea you think the residents will like best. Are they the same idea? Why or why not?
A team wants to test a thicker conductor in the simulator. Which input is realistic?
Instruction ~10 min
Class criteria and constraints for the wind-to-town link (set in 3.02, weighted in 3.07). Criteria: (1) on our classroom-scale model (a 12 V AC source, a 10 Ω line and a 10 Ω town load) the design delivers at least 95% of the energy sent; (2) at full scale (100 MW over a 40 km line with 10 Ω of resistance) the line loses no more than 2% of the power; (3) low land and wildlife impact; (4) low wildfire and safety risk in high winds. Constraints: a budget of at most 12 sample budget points; the source voltage and the town’s load are fixed; transformer pairs come only in ratios of 1:5, 1:10 and 1:20; every number must be labeled as sourced or illustrative; two build periods.
Weighting the criteria. At the public meeting the commission gave its priorities. Our sample weights: energy delivered 30%, wildfire and safety 30%, land and wildlife 20%, cost 20%. Constraints are pass or fail: any design over budget or below 95% delivered on the scale model is out, however well it scores elsewhere.
Sample budget points for each change.
| Change | Effect in the model | Cost (points) | Side effects to score |
|---|---|---|---|
| Baseline line on the ridge route | R = 10 Ω | 4 | long ridge crossing in high winds |
| Thicker conductor | R = 5 Ω | +3 | heavier wire, stronger towers |
| Shorter valley route | R = 6 Ω | +1 | crosses a wetland |
| Transformer pair 1:5 / 1:10 / 1:20 | line voltage ×5 / ×10 / ×20 | +3 / +4 / +6 | taller towers and wider clearances at higher voltage |
| Local storage in town | trims the peak current | +4 | battery site in town |
Worked example 1: predicting before simulating. Jamal’s team chose a 1:10 transformer pair. Prediction: the line now runs at 120 V; seen from the line, the town’s 10 Ω looks like 10 × 102 = 1,000 Ω; the line current is 120 ÷ 1,010 = 0.119 A; the line wastes (0.119)2(10) = 0.141 W and the town gets 14.1 W, so 99.0% is delivered. The simulator gave 14.1 W and 0.14 W, matching the prediction. When a simulation and a hand calculation agree, you can trust both a little more; when they disagree, find out why before going on.
Sample results on the scale model (ideal transformers).
| Design | Line current (A) | Line loss (W) | Town power (W) | Delivered | Cost |
|---|---|---|---|---|---|
| Baseline | 0.600 | 3.60 | 3.60 | 50.0% | 4 |
| Thicker conductor | 0.800 | 3.20 | 6.40 | 66.7% | 7 |
| Shorter route | 0.750 | 3.38 | 5.63 | 62.5% | 5 |
| 1:5 pair | 0.231 | 0.53 | 13.31 | 96.2% | 7 |
| 1:10 pair | 0.119 | 0.14 | 14.12 | 99.0% | 8 |
| 1:20 pair | 0.060 | 0.036 | 14.33 | 99.75% | 10 |
Changing the resistance alone cannot pass criterion (1): the current stays large and the loss goes as I2. Every passing design raises the line voltage.
Worked example 2: a decision matrix (sample scores, 1 to 5).
| Design | Delivered (30%) | Wildfire and safety (30%) | Land and wildlife (20%) | Cost (20%) | Weighted total |
|---|---|---|---|---|---|
| A: 1:20 pair, ridge route | 5 | 2 | 3 | 2 | 3.1 |
| B: 1:10 pair, ridge route, high-wind shutoff sensors | 5 | 3 | 3 | 3 | 3.6 |
| C: 1:10 pair, shorter valley route | 5 | 4 | 2 | 4 | 3.9 |
| D: thicker conductor only | Out: fails criterion (1) at 66.7% | ||||
Design A delivers the most energy but loses on wildfire risk and cost. Design C wins on these weights, but its wetland crossing scores low for land and wildlife. A matrix does not make the decision for you; it makes the trade-offs visible so you can defend one. Change the weights and the winner may change: test that before you present.
Predicting effects beyond the simulator. A higher line voltage needs taller towers, longer insulators and wider clearances, which affect the landscape and the budget. A valley route avoids the windiest ground but crosses habitat. Write each predicted effect next to the design in your log.
Guided Exercises ~15 min
Each team builds one design; the class pools results.
Independent Practice ~10 min
Complete the design pages of your Grid Notebook.
Using the class results, fill in a decision matrix for at least three designs with your own scores and the class weights. Explain each score in one line of evidence. Then change one weight by 10 points and say whether your winner changes.
Closure ~5 min
We have competing designs, tested results and a first ranking. Next lesson: critique, a test against every criterion, and version 2.
Exit ticket: why can raising the voltage pass criterion (1) when a thicker conductor cannot?
How confident are you that you can I can test design options in a simulation with realistic inputs and rank them in a weighted decision matrix.
Teacher notes
Materials: devices with the Falstad simulator (link-out), printed decision matrices. Teams without devices compute by hand with the reflected-resistance method.
Setup: assign each team a different single change so the class covers every row. All costs, scores and weights are sample values; the resistances are a classroom-scale model, not real line data.
Listen for: setting R to zero; changing two things at once; treating the matrix total as the answer instead of the start of an argument.
Support / stretch: give a pre-built baseline circuit file. Stretch: model local storage as a 30% lower peak current at full scale and compute its effect on I2R.