2.08 Critique and Iterate: Gallery Walk, Hold-Time Test and Version 2
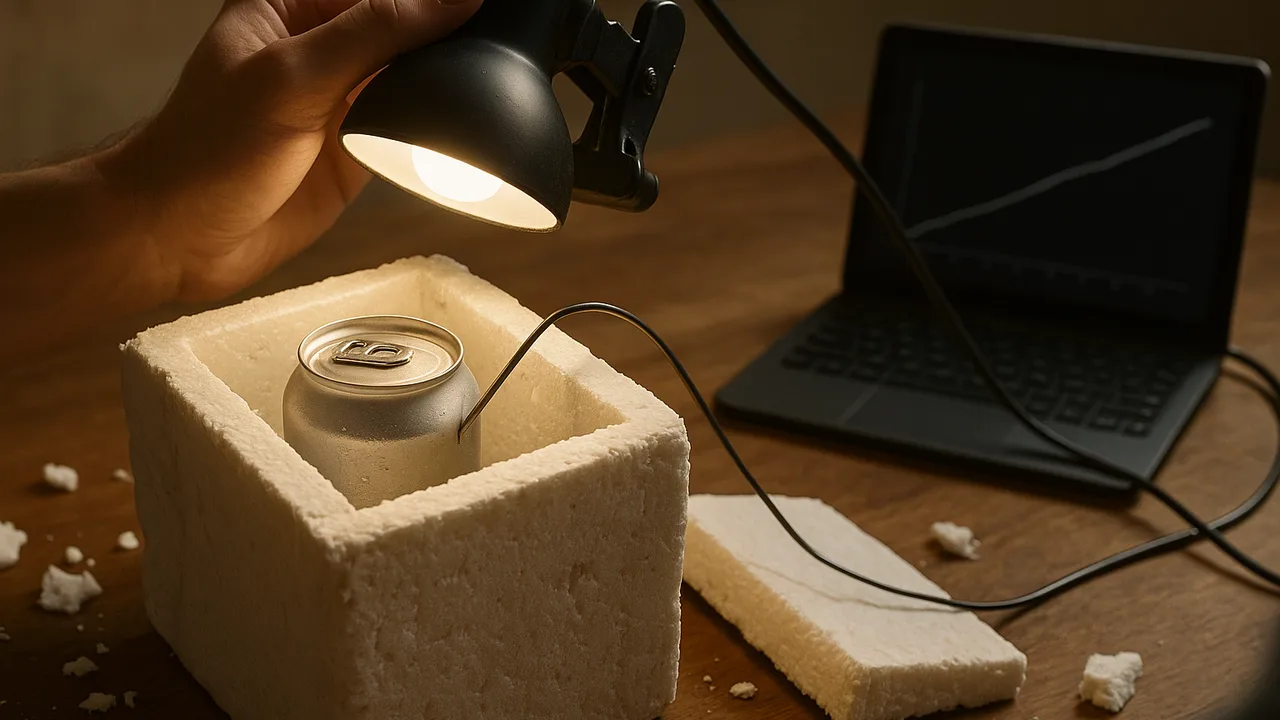
evaluate version 1 against every criterion with warming-curve data, find where energy leaked in, and use critique to build and test version 2.
- I can collect and record the data needed to calculate the change in thermal energy for each component in the system.
- I can evaluate my investigation by analyzing the accuracy and precision of my data, identifying any limitations, and determining if my data provide the evidence I need.
- I can identify possible reasons why energy might appear to be lost from my closed system and suggest changes to my experiment to reduce these losses.
Phase 4: Build
Warm-Up ~5 min
Do Now. Look at your version 1 warming curve and the control. At what time did each cross 10 °C? Where on the curve did the warming speed up?
Version 1's can stayed near 5 °C for 70 minutes, then warmed quickly. What most likely happened at 70 minutes?
Instruction ~10 min
Class criteria and constraints for the Cool Carrier (set in 2.02, ranked in 2.07). Criteria: (1) a 355 mL can of water starting at 5 °C stays below 10 °C for at least 90 minutes in a lamp-heated test box at 35–40 °C; (2) it is reusable: five test runs with no more than 10 minutes lost from the hold time; (3) a volunteer can carry it in one hand and open it in under 5 seconds. Constraints: empty mass no more than 400 g; fits inside a 25 cm cube; materials cost no more than $5 at the sample class prices; no electricity; at most 200 g of ice, sealed in a bag; no dry ice and no chemical cold packs that must be opened.
Gallery critique protocol (15 minutes). Each team leaves its carrier, model diagram and warming curves at its station. Visitors spend three minutes per station and leave one “I like” tied to data, one “I wonder” about a leak or a measurement, and one “What if” with a specific change. Home teams sort notes into “change now”, “test later” and “no”.
Worked example 1: closing the energy account (sample data). Ava’s version 1 started with 200 g of ice; after 90 minutes, 70 g of ice was left. Melted ice: 0.130 kg × 334,000 J/kg = 43,420 J. The can stayed at about 5 °C. Average leak rate: 43,420 J ÷ 5,400 s ≈ 8.0 W, a little above the model’s 7.6 W. Energy gained by the inside equals energy that crossed the boundary, so the extra 0.4 W points to a leak the model left out: the lid gap.
Worked example 2: accuracy, precision and limits. Two trials of version 1 gave hold times of 92 and 104 minutes. The spread (12 minutes) is the precision. The box drifted from 36 to 40 °C during trial 2, a limitation that may explain part of the gap. To improve the investigation, the team clamped the lamp at a fixed height, added a box thermometer, and sealed the thermometer hole in the lid with putty.
Worked example 3: choosing the change. Critique notes said, “I wonder if warm air gets in when the lid shifts.” The team added a fleece gasket under the lid. Version 2 held 121 and 126 minutes. The gain (about 26 minutes) is larger than either spread, so the change worked. They explained it at the particle scale: the soft gasket fills the gap, so warm air molecules cannot flow in and carry energy by convection.
| Criterion or constraint | Target | Version 1 | Met? | Version 2 | Met? |
|---|---|---|---|---|---|
| Hold time below 10 °C | ≥ 90 min | ||||
| Reusable | 5 runs, ≤ 10 min loss | ||||
| Carry and open | one hand, < 5 s | ||||
| Empty mass | ≤ 400 g | ||||
| Size | 25 cm cube | ||||
| Cost | ≤ $5 |
Guided Exercises ~15 min
Use your warming curves, ice data and critique notes.
Independent Practice ~10 min
Build and test version 2, then update the design log.
Design log: the criteria table for versions 1 and 2, both warming curves with the control, an energy account from the melted ice, one limitation of your test and how you revised the procedure to reduce it.
🔎 Mini case study: The vacuum flask: insulating by removing the particles ~8 min
In 1892 the Scottish scientist James Dewar needed to keep very cold liquefied gases from warming up in his laboratory. His solution was a double-walled glass vessel with the air pumped out of the space between the walls. With almost no gas particles in the gap, conduction and convection across it nearly stop. He also silvered the glass surfaces so they reflect radiation. A few years later, companies began selling the same design as a vacuum flask for keeping drinks hot or cold.
Vacuum insulation is still used in flasks and some cold-storage equipment. Its weak points are where the two walls meet at the neck, and the stopper, because energy can conduct through solid material there.
Think about it: Explain at the particle scale why removing the air between the walls blocks conduction and convection but not radiation. Where would you expect a vacuum flask to leak the most energy, and why?
Closure ~5 min
Version 2 is tested and the energy account is closed. Next: Delivery Day with the final test and defense.
Exit ticket: where did most of the energy get into your version 1, and what is your evidence?
How confident are you that you can I can evaluate a thermal investigation for accuracy, precision and limitations and use the data to improve a design.
Teacher notes
Materials: carriers and data from 2.07, lamp test boxes, thermometers, sticky notes in three colors, spare foam, fleece, foil and tape.
Setup: finish version 1 readings first. Gallery walk 15 min, planning 5 min, build version 2 and start its hold test 20 min, log 10 min. All numbers in worked examples are sample data.
Listen for: “the foil keeps the cold in”; precision confused with accuracy; ignoring the box temperature.
Support / stretch: assign visitor roles (leak finder, data checker, materials checker). Stretch: estimate the lid-gap leak in watts from the difference between measured and modeled leak rates.