4.03 Standing Waves Lab: Measuring Wave Speed Two Ways
measure the frequencies and wavelengths of standing-wave harmonics, compute the wave speed, compare it with the prediction v = √(T/μ) including uncertainty, and use data to show how the medium sets the speed.
- I can show that multiplying a wave’s frequency by its wavelength gives a constant value, which is the wave’s speed, using the equation v = fλ.
- I can use data to show that the speed of a wave changes when it travels through different media.
- I can use mathematical relationships to distinguish between cause and correlation when supporting claims about waves.
Phase 2: Investigate
Warm-Up ~5 min
Do Now. Pluck a stretched rubber band, then stretch it tighter and pluck again. What changed about the sound? Write a guess about why.
A string shows one loop at 22 Hz. At what frequency will it show three loops, with the same tension?
Instruction ~10 min
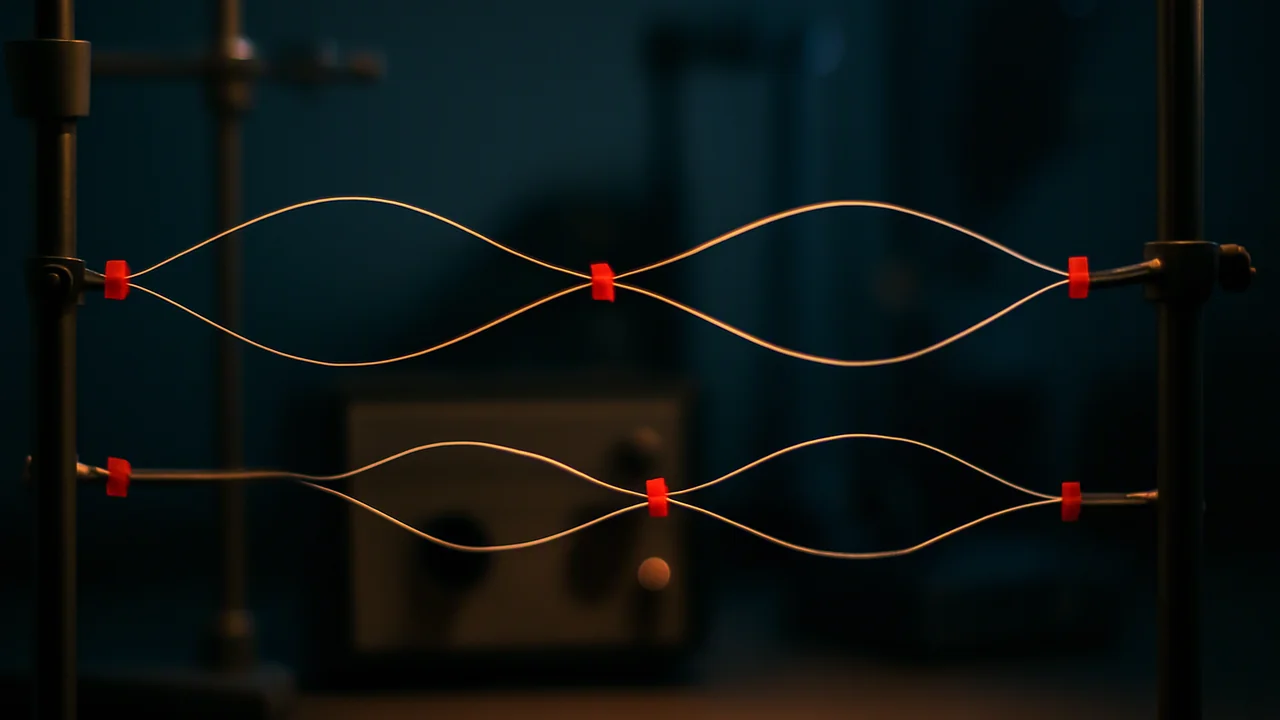
From a traveling wave to a standing wave. Send a wave down a string tied at both ends. It reflects at each end and the reflected wave overlaps the incoming one. At most frequencies the overlapping waves blur into a jumble. At certain frequencies they add up to a steady pattern that does not seem to travel at all: a standing wave. Points that never move are nodes; points that swing the most are antinodes.
Why only certain frequencies? Both fixed ends must be nodes. Adjacent nodes are half a wavelength apart, so the string length L must hold a whole number of half-wavelengths: L = nλ/2, or λn = 2L/n for n = 1, 2, 3, and so on. These are the harmonics. Combine this with v = fλ: fn = n·v/(2L). Each harmonic’s frequency is a whole-number multiple of the fundamental f1 = v/(2L). This is a pattern you can test: if your measured frequencies go roughly 1 : 2 : 3 : 4, the model is working.
What sets the speed on a string? Two properties of the string. The tension T (in newtons) pulls each displaced piece back toward rest; more tension means a faster restoring pull and a faster wave. The linear mass density μ (mass per unit length, kg/m) is the inertia that resists being accelerated; a heavier string carries a slower wave. The model is v = √(T/μ). Check the units: N/(kg/m) = (kg·m/s2)·(m/kg) = m2/s2, and the square root is m/s.
Worked example (this lab’s setup, illustrative numbers). A 2.00 m length of string has mass 1.00 g, so μ = 1.00 × 10⁻³ kg / 2.00 m = 5.00 × 10⁻⁴ kg/m. A 100 g mass hangs over the pulley, so T = mg = 0.100 × 9.8 = 0.98 N. The predicted speed is v = √(0.98/0.0005) = 44.3 m/s. With a vibrating length of L = 1.00 m, the fundamental is f1 = 44.3/(2 × 1.00) = 22.1 Hz, the second harmonic 44.3 Hz and the third 66.4 Hz.
Getting speed from your measurements. For each harmonic you measure the frequency (from the tone-generator app or by timing) and the wavelength (twice the node-to-node distance, or 2L/n). Then v = fλ. In the illustrative data below, the four harmonics give speeds of 43.2, 44.5, 43.9, 44.5 m/s, a mean of 44.0 m/s, which differs from the √(T/μ) prediction by -0.6%. The spread among the four values gives a rough uncertainty. A graph of f against n should be a straight line through the origin with slope v/(2L); its slope is a better estimate than any one point.
Scaling reasoning. Because v depends on the square root of T, doubling the hanging mass does not double the speed: it multiplies it by √2 ≈ 1.41, giving 62.6 m/s here. To double the speed you need four times the tension.
Common misconceptions. (1) “Nodes are where the string is fastest.” Nodes never move; antinodes move fastest. (2) “The wavelength is the length of one loop.” One loop is half a wavelength. (3) “The standing wave has zero speed, so v = fλ does not apply.” A standing wave is two traveling waves going opposite ways, each at v; the pattern stands still, the waves do not. Connect this to earthquake early warning: seismologists find wave speeds in rock the same way you do here, from measured times, distances and the properties of the medium.
Changing the medium. Tie the light string (μ = 5.00 × 10⁻⁴ kg/m) to a heavier one (μ = 2.0 × 10⁻³ kg/m, four times as heavy per meter) under the same 0.98 N tension. The heavy string’s speed is √(0.98/0.0020) = 22.1 m/s, half the light string’s 44.3 m/s. A 44.3 Hz wave sent from the light side keeps its frequency as it crosses the knot, because the knot moves up and down at one rate for both strings. So its wavelength must change: λ = v/f = 1.00 m on the light string and 0.50 m on the heavy one. This is the same rule as sound entering water or light entering glass: new medium, same frequency, new speed, new wavelength.
Cause or correlation? In the sample data, higher harmonics have both higher frequencies and shorter wavelengths. Ravi noticed this and claimed, “Higher frequency makes the wave slower, because the wavelength drops.” The numbers show a correlation between f and λ, but the product fλ stays near 44 m/s for every harmonic: frequency does not cause a change in speed. To find a cause, change one variable while holding the others fixed. When the hanging mass, and so the tension, is doubled with everything else the same, the speed rises by about √2. That controlled change is evidence that tension causes the speed change; the f-λ pattern alone is only a correlation that the equation v = fλ explains.
Lab procedure: Standing Waves on a String: Measuring Wave Speed Two Ways
Question. Does the wave speed found from standing-wave measurements (v = fλ) agree with the speed predicted from the string’s tension and mass per length (v = √(T/μ))?
Materials.
- About 2.5 m of thin, strong string (braided fishing line or kite string) and a kitchen or school balance that reads to 0.01 g
- A pulley clamped to the table edge (or a smooth dowel), and slotted masses or a zip bag of washers (50-200 g) as the hanging mass
- A vibration source: a small 4-8 Ω speaker driven by a free tone-generator app through a phone’s headphone output (or a battery-powered mini amplifier), with the string taped to a paper clip glued to the cone
- Meter stick or tape measure, masking tape, stopwatch
- Route B (no speaker): a long rope or a metal or plastic spring toy (slinky) and a partner
- Safety goggles for everyone at the station
Procedure.
- Measure the full length of a 2.00 m piece of the string and its mass on the balance; compute μ = mass/length in kg/m.
- Tie one end to the speaker’s paper clip, run the string over the pulley and hang the mass. Measure the vibrating length L from the speaker to the top of the pulley. Record the hanging mass and compute T = mg.
- Start the tone generator at a low frequency and raise it slowly until the string forms one large, steady loop (n = 1). Record the frequency. Repeat for 2, 3 and 4 loops.
- For each pattern, measure the distance between adjacent nodes with the meter stick and double it to get λ. Compare with 2L/n.
- Change the hanging mass (for example double it) and find the fundamental again to test how v depends on T.
- Route B: stretch the rope or spring about 4 m along the floor. One partner holds one end still; the other shakes the far end side to side, adjusting the rhythm until a steady pattern of 1, 2 and then 3 loops forms. Time 10 shakes for each pattern to get f, and measure node spacing for λ.
Data table.
| Harmonic n | Frequency f (Hz) | Node spacing (m) | λ (m) | v = fλ (m/s) |
|---|---|---|---|---|
| 1 | ||||
| 2 | ||||
| 3 | ||||
| 4 | ||||
| Illustrative sample (not real data): L = 1.00 m, hanging mass 100 g (T = 0.98 N), μ = 5.00 × 10⁻⁴ kg/m | ||||
| 1 (illustrative) | 21.6 | 1.000 | 2.000 | 43.2 |
| 2 (illustrative) | 44.5 | 0.500 | 1.000 | 44.5 |
| 3 (illustrative) | 65.8 | 0.333 | 0.667 | 43.9 |
| 4 (illustrative) | 88.9 | 0.250 | 0.500 | 44.5 |
| Illustrative mean v = 44.0 m/s; predicted √(T/μ) = 44.3 m/s; percent difference -0.6% | ||||
Analysis.
- Claim-evidence-reasoning: Do your two speeds agree? State your mean v = fλ and your √(T/μ), the percent difference, and explain why the two methods should give the same number.
- Graph f against n. Is it a straight line through the origin? Use the slope (which equals v/(2L)) to find v and compare it with your mean.
- Uncertainty: use the spread of your four v values (highest minus lowest, divided by 2) as an uncertainty. Is the difference from √(T/μ) larger or smaller than that?
- Sources of error: the node at the speaker is not perfect, the string stretches under tension so μ decreases slightly, the pulley has friction, and judging the steadiest pattern is subjective. Which one would most likely make your v = fλ too high or too low, and why?
- When you doubled the tension, by what factor did the fundamental frequency change? Compare with the √2 predicted by the model.
Other routes to the same data. Choose one. All three earn full credit and end in the same f-against-n graph and speed comparison. Option A — speaker and string, or Route B with a rope or spring toy. The procedure above. Option B — the sample rows in the table above. No equipment needed. Graph f against n, find v from the slope, compare it with √(T/μ) and complete every analysis question. Option C — PhET Wave on a String. Oscillate, Fixed End, no damping: produce 1, 2 and 3 loops, measure λ with the ruler and the period with the timer, and compute v = fλ for a low and a high tension. Cite the sim and the date you used it.
Guided Exercises ~15 min
Use the sample table, then your own data.
Independent Practice ~10 min
Write up the lab in your Signal Notebook.
Write your lab's claim-evidence-reasoning paragraph. Give your mean v = fλ, your √(T/μ) value and the percent difference, state your uncertainty, and name the source of error you think mattered most and which way it pushed your result.
Use your data (or the sample rows plus the heavy-string example) to show that the wave's speed depends on the medium. Then explain the difference between the correlation you see between f and λ and the cause of a change in speed.
Closure ~5 min
Two methods, one speed: the medium sets v, and v = fλ ties it to what we measure. Next lesson: when information rides on waves, is digital always better?
Exit ticket: a wave goes from a light string to a heavy one. What happens to its frequency, speed and wavelength, and why?
How confident are you that you can I can find a wave speed from standing-wave data, compare it with a model and show how the medium sets the speed.
Teacher notes
Materials: see the lab list; one speaker or rope station per team. Reading: OpenStax Physics (high school), chapter 13, and OpenStax College Physics 2e, chapter 16 (CC BY 4.0).
Timing: Poly ran this lab over two 50-minute sessions. Period one: μ, T and the four harmonics; period two: the doubled tension, graph and analysis.
Listen for: one loop called a whole wavelength; nodes called the fastest points; “higher f is faster”.
Support / stretch: pre-label the f-against-n graph axes. Stretch: predict the fundamental for a 0.75 m vibrating length and test it.