3.02 Project Brief and Wonder Board: The Wind-to-Town Challenge
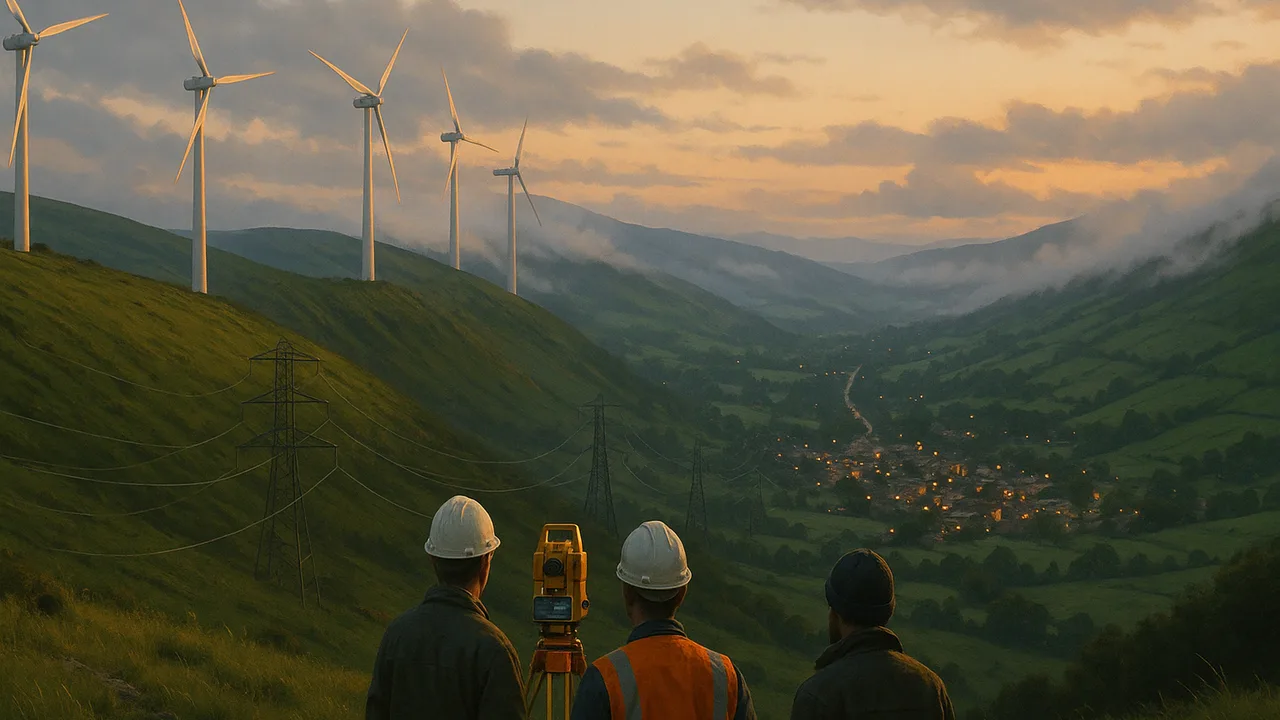
Wind to Wire: Connecting a Ridge-Top Wind Farm to Town
How can we use a simulation to design a link that carries a wind farm’s energy to a town with the least waste and the fewest harms, and explain the physics of every step from wind to outlet?
The mystery: During a dry offshore wind event, reaching for a doorknob gives a sharp spark, while on a ridge nearby the same wind turns turbines that send electricity to a town 40 km away. How do charges and magnets push on each other without touching, and how does moving air become current in a distant outlet?
Questions we will figure out together in this unit:
- Why does a doorknob shock happen more on dry days?
- How can two charges push each other without touching?
- How does a spinning turbine make an electric current?
- Why are power lines run at such high voltages?
- Where does the energy lost in a power line go?
- Can a magnet make electricity just by sitting near a wire?
- How do transformers change voltage, and do they waste energy?
- How far can we trust a computer simulation of the grid?
explain the county’s problem, describe the wind-to-town system we will model with its boundaries, criteria and constraints, and organize the need-to-knows and team roles.
- I can identify the complex real-world problem being modeled in a computer simulation, including its criteria and constraints.
- I can describe the system being modeled, including its boundaries.
- I can identify which variables I can change in the simulation and explain the scientific principles or relationships the model uses.
Phase 1: Spark
Warm-Up ~5 min
Do Now. Look at the power lines nearest your home or school. List everything you notice: tower height, number of wires, insulators, how far apart the towers are. Then answer the prediction.
A wind farm sends 100 MW to a town through a long line. Which change would cut the energy wasted in the line the most?
Instruction ~10 min
Meet the client. A county planning commission has approved a new wind farm on a ridge above a valley. The town that will use most of its electricity sits 40 km down the valley. Before any towers go up, the commission must recommend how to connect them: what voltage, what conductor, which route, and whether to add storage in town. Residents have asked hard questions at public meetings: “How much of the energy is wasted on the way?”, “Why do the lines need such tall towers?” and “Will a line along the ridge raise the wildfire risk on windy days?” The commission has asked our class for a design report that tests solutions in a simulation and recommends one with its trade-offs.
Your mission. Grid engineers, your team will model the link from turbine to town, test at least three solutions in a circuit simulator, and defend a recommendation to the commission with physics and data. Along the way you will learn how charges, currents and magnetic fields make the whole system work.
Class criteria and constraints for the wind-to-town link (set in 3.02, weighted in 3.07). Criteria: (1) on our classroom-scale model (a 12 V AC source, a 10 Ω line and a 10 Ω town load) the design delivers at least 95% of the energy sent; (2) at full scale (100 MW over a 40 km line with 10 Ω of resistance) the line loses no more than 2% of the power; (3) low land and wildlife impact; (4) low wildfire and safety risk in high winds. Constraints: a budget of at most 12 sample budget points; the source voltage and the town’s load are fixed; transformer pairs come only in ratios of 1:5, 1:10 and 1:20; every number must be labeled as sourced or illustrative; two build periods.
Worked example 1: describing the system. Mei’s team drew the system boundary around everything from the turbine’s generator to the town’s outlets: generator, step-up transformer, 40 km of line, step-down transformer and the town’s load. Wind crosses the boundary as kinetic energy coming in; thermal energy leaves from the warm line, transformers and generator. Inside, energy is carried by charges moving through the electric field in the wires. Their energy equation per second: Pgenerated = Ptown + Pline loss + Ptransformer loss.
Worked example 2: what the simulation can and cannot change. Diego listed the variables the team can change in the simulator: the transformer turns ratio, the line’s resistance (a thicker conductor or a shorter route) and the load. The model relies on V = IR, P = I2R and the transformer rule Vs/Vp = Ns/Np. Variables it cannot change: land use, wildlife, wildfire risk and cost. Those go in the decision matrix, scored from evidence outside the simulation.
Worked example 3: a first estimate. If the farm sends 100 MW at 115 kV through a 10 Ω line, I = P/V = 870 A and the loss is I2R = 7.6 MW, or 7.6% (illustrative line resistance). That already fails criterion (2), so doing nothing is not an option.
Team roles. Teams of three or four rotate weekly: Project Manager (schedule, criteria, budget), Modeler (builds and saves the simulation circuits), Data Lead (results table, scale-up calculations, uncertainty) and Communications Lead (diagrams, report sections, the commission presentation).
Guided Exercises ~15 min
Work as a new team. Discuss each card before answering.
Independent Practice ~10 min
Set up the project pages in your Grid Notebook.
Write the commission's problem in two or three sentences: who needs what, the criteria and constraints, and how we will know a design is good enough. Then list two things a computer simulation can tell the commission and two things it cannot.
Add your three best need-to-know questions to the Wonder Board, and say which lesson ahead you think will answer each one.
Closure ~5 min
We have a client, a system, criteria and teams. Next phase we investigate: first, how current, voltage and resistance share energy in a circuit.
Exit ticket: which single variable do you think will matter most for the line loss, and why?
How confident are you that you can I can describe the wind-to-town system with its boundary, criteria and constraints, and say what a simulation of it can and cannot show.
Teacher notes
Materials: printed client brief (a generic letter from a county planning commission), Wonder Board chart paper, role cards, photos of transmission towers at several voltages.
Setup: the client and the wind farm are fictional and generic; the 10 Ω line resistance and budget points are sample values. If a local utility or planning office will join by video, adapt the letter. Post the criteria and constraints all unit.
Listen for: “the line uses up current”; systems with no boundary; criteria confused with constraints; trust in the simulation as if it were the real line.
Support / stretch: give a labeled system template. Stretch: estimate the line loss at 345 kV and say whether it meets criterion (2).