3.06 From Wind to Outlet: Revising the Model, CER and Ideate
revise our wind-to-outlet model into a computational model, use it to predict the most energy that can reach town, write a CER about where the energy goes, and brainstorm solutions for the county’s link.
- I can use my model to determine if the energy stored in the field increases, decreases, or stays the same when the two objects interact.
- I can use my model to support the claim that the change in energy stored in the field matches the change in energy of the objects.
- I can use a computational model to predict the maximum possible change in the energy of one component in a system for a given set of energy flows.
Phase 3: Make Sense
Warm-Up ~5 min
Do Now. Find the energy chain you wrote at the start of lesson 3.05. Circle one link you would now explain differently, and write what you learned that changed it.
If the wind speed doubles, the power in the wind passing through a turbine's swept area doubles.
Instruction ~10 min
Revising the model. Our first model in lesson 3.02 was a box diagram: wind in, electricity out, some energy “lost”. We can now say what happens at every step and put a number on it. That turns a picture into a computational model the county can use.
Step 1: the wind. Air of density ρ moving at speed v through a rotor’s swept area A carries kinetic energy at the rate P = ½ρAv3. For blades 50 m long, A = π(50)2 = 7,854 m2. With ρ = 1.2 kg/m3 and v = 10 m/s, P = 4.71 MW (illustrative turbine). No rotor can capture all of it: the air must keep moving to leave. A classic result called the Betz limit puts the maximum at 16/27, about 59.3%, so the most this rotor could ever deliver is 2.79 MW. That is the computational model’s prediction of the maximum possible energy change for a given flow.
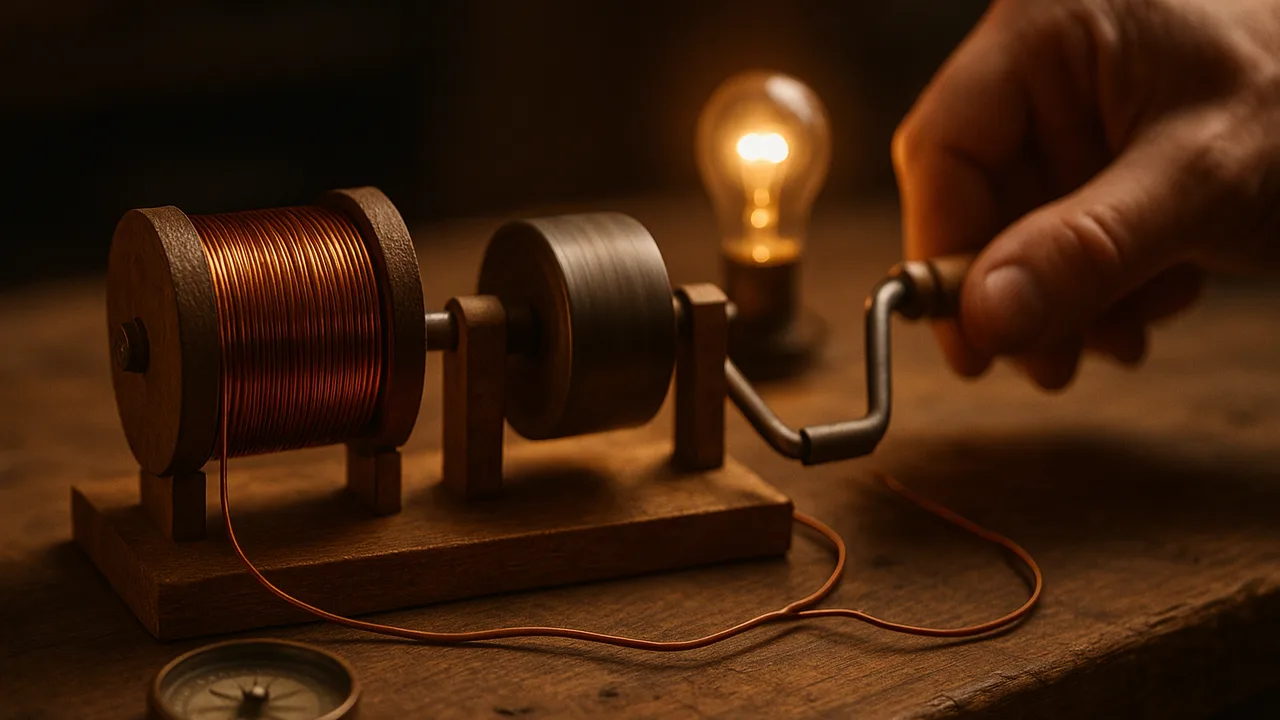
Step 2: the generator (fields at work). The spinning rotor turns magnets past coils, so the flux through each coil changes and Faraday’s law induces a voltage. When the town draws current, that current sits in the magnetic field and feels a force that opposes the rotation (Lenz’s law). The wind must do work against that magnetic force, and the work done equals the electrical energy produced. The field is the go-between: energy flows from the moving rotor, through the magnetic field, into the moving charges in the wire.
Step 3: the chain, as a spreadsheet (illustrative efficiencies).
| Stage | Efficiency | Power out (MW) |
|---|---|---|
| Wind through swept area | — | 4.71 |
| Rotor (below the 59.3% Betz limit) | 45% | 2.12 |
| Generator | 95% | 2.01 |
| Step-up transformer | 99% | 1.99 |
| Transmission line | 98% | 1.95 |
| Step-down transformer | 99% | 1.93 |
Overall, 1.93 ÷ 4.71 = 41% of the wind’s power reaches town. Every missing megawatt is accounted for: most of it is kinetic energy the air keeps as it leaves, the rest is thermal energy in the gearbox, generator, transformers and line.
Worked example: using the model to find one unknown. At a wind speed of 8.0 m/s the town measures 0.95 MW. What fraction of the wind’s power arrived? Pwind = ½(1.2)(7,854)(8.0)3 = 2.41 MW, so 0.95 ÷ 2.41 = 39%. If every other stage keeps the efficiencies above, the rotor must have run at about 0.39 ÷ (0.95 × 0.99 × 0.98 × 0.99) ≈ 43%.
Limits of the model. It assumes a steady wind (real wind gusts, and power goes as v3, so averaging the speed underestimates the power), fixed efficiencies (real ones change with load) and a line that wastes a fixed 2% (real loss depends on I2R, which depends on the voltage we choose). That last assumption is exactly what our design will change.
CER with sentence starters. Question: Where does the energy that lights a lamp in town come from, and why does less than half of the wind’s energy arrive? Claim: “The energy comes from…” Evidence: “Our model shows… and the induction lab showed…” Reasoning: “Because a changing magnetic flux…, and because the force from the field opposes…, energy is…”
Ideate. Brainstorm at least six ways to raise the energy that reaches town or lower the harm the link causes. Sort each idea by what it changes in the model: the current (higher transmission voltage, local storage that trims the peak), the resistance (thicker or better conductors, a shorter route), or the land and safety impact (burying a section, routing away from dry brush, sensors that cut power in high winds). Defer judgment: quantity first, quality in lesson 3.07.
Guided Exercises ~15 min
Use the chain table. Show each multiplication.
Independent Practice ~10 min
Write the CER, then run the Ideate round with your team.
CER: Where does the energy that lights a lamp in town come from, and why does less than half of the wind's energy arrive? Use the chain table and your induction-lab evidence, and include the role of the magnetic field in the generator. Name one limitation of the model.
Ideate: list at least six solutions for the county's link. For each, write which model quantity it changes (current, resistance or impact) and one possible downside. Star the three you want to test in the simulator.
Closure ~5 min
Our model now tracks energy from wind to outlet and tells us where to aim. Next phase: build the link in the simulator and test real options.
Exit ticket: which stage of the chain would you improve first for the county, and what evidence from the model supports that choice?
How confident are you that you can I can use a computational model of the wind-to-outlet chain, explain the field's role in energy transfer, and name the model's limits.
Teacher notes
Materials: chain-table spreadsheet template, chart paper for the Ideate round. Reading: OpenStax College Physics 2e, chapters 7 and 23 (CC BY 4.0).
Setup: turbine size and stage efficiencies are illustrative; the Betz limit (16/27) is a standard textbook result. CER 20 min, Ideate 15 min.
Listen for: “energy is lost” with no destination; v instead of v3; magnets as an energy source.
Support / stretch: give the spreadsheet with formulas filled in. Stretch: show why averaging a gusty wind’s speed underestimates its average power.