1.04 Where Did the Energy Go? Springs, Rubber Bands and Thermal Energy
calculate elastic potential energy from a spring constant or a force-stretch graph, trace energy into thermal energy at the particle scale, and argue from measurements that energy is conserved when a device seems to lose it.
- I can describe how changes in the positions of objects in gravitational, magnetic, or electrostatic fields affect the energy stored in those fields.
- I can explain that thermal energy includes both the kinetic and potential energy of particle vibrations in solids or molecules, and the kinetic energy of freely moving particles in liquids and gases.
- I can describe how the total energy of a system and its surroundings is conserved at both the macroscopic and molecular/atomic levels.
- I can use my models to show that in closed systems, energy is conserved at both the macroscopic and molecular/atomic scales, so that as one form of energy changes, the total energy stays constant, as shown by other forms of energy changing by the same amount or only by the energy transferred into or out of the system.
- I can use a computational model to calculate the change in energy of one component in a system when I know the changes in energy of other components and the energy flows.
Phase 2: Investigate
Warm-Up ~5 min
Do Now. Stretch a rubber band quickly several times and touch it to your lip or wrist (gently). What do you notice? Write one sentence about where that energy came from.
A rubber-band car rolls across the floor and stops. A skeptic says the energy was used up. What is the strongest first reply?
Instruction ~10 min
The argument. A rubber-band car rolls across the floor and stops. A pumped-storage plant returns only about three quarters of the energy it stores. A skeptic says: “Then energy is not really conserved; it gets used up.” Today you gather evidence and build the counter-argument: energy is conserved in every case, but some of it ends up where it is hard to use. To make that argument you need two more energy stores, elastic and thermal, and a way to see both at the particle scale.
Elastic potential energy. Stretch or compress a spring and it pushes back with a force proportional to the displacement, F = kx (Hooke’s law), where k is the spring constant in N/m. Worked example: a 200 g mass hung on a spring stretches it 4.9 cm, so k = mg/x = (0.200)(9.8)/0.049 = 40 N/m. The work you do stretching it is the area under the force-stretch graph, a triangle: PEelastic = ½kx2.
Worked example: a spring launcher. A launcher with k = 250 N/m is compressed 4.0 cm and fires a 50 g ball straight up. Stored energy: ½(250)(0.040)2 = 0.200 J. If all of it became gravitational potential energy, the ball would rise h = 0.200/((0.050)(9.8)) = 0.408 m. The measured rise is 0.34 m (illustrative numbers), so only (0.050)(9.8)(0.34) = 0.1666 J reached the top: 83%. The missing 0.0334 J did not vanish. It went into the vibrating spring, air drag, sound, and a slight warming of the spring and the ball.
Real materials are not ideal springs. A rubber band’s force-stretch graph curves (illustrative numbers):
| Stretch x (m) | 0.00 | 0.05 | 0.10 | 0.15 | 0.20 | 0.25 |
|---|---|---|---|---|---|---|
| Force F (N) | 0.0 | 1.6 | 2.6 | 3.3 | 4.0 | 4.9 |
The energy stored is still the area under the curve. Split it into trapezoids, each (width) × (average height): 0.05 × (0 + 1.6)/2 + 0.05 × (1.6 + 2.6)/2 + … = 0.6975 J. Treating the band as ideal, ½Fx = ½(4.9)(0.25) = 0.6125 J, would underestimate it by 12%. When this band launches an 80 g cart that leaves at 2.6 m/s, the cart has ½(0.080)(2.6)2 = 0.2704 J, only 39% of the stored energy. Rubber gets measurably warm when stretched and released quickly: the rest became thermal energy inside the band.
The particle view (HS-PS3-2). At the scale you can see, energy is either motion (kinetic) or position in a field (gravitational, elastic, electric). At the particle scale the same two categories apply. Elastic energy is stored in the electric fields between molecules as bonds and chains are stretched. Thermal energy is the random kinetic energy of molecules jiggling plus the potential energy of their jostled bonds. When a 1,200 kg car brakes from 25 m/s, its 375,000 J of kinetic energy does not disappear: friction turns ordered motion of the whole car into disordered motion of the molecules in the brake pads and discs, which get hot. Energy that has spread into random molecular motion is still there, but it is hard to collect again. Unit 2 turns that idea into the second law of thermodynamics.
Building the argument. A strong argument names the system, accounts for every joule you can measure, identifies where the “missing” energy went with evidence (a warm band, sound, a slowing cart), and answers the counterclaim directly.
Lab procedure: Rubber-band launcher: stored energy versus kinetic energy
Question. How much of the energy stored in a stretched rubber band becomes kinetic energy of a launched cart, and where does the rest go?
Materials.
- Several identical rubber bands and a toy car or small cart
- A spring scale (0-10 N) or a set of known masses with a cup hanger
- Meter stick, masking tape and a phone camera (for video timing)
- Two chairs or a heavy table leg to anchor the band
Procedure.
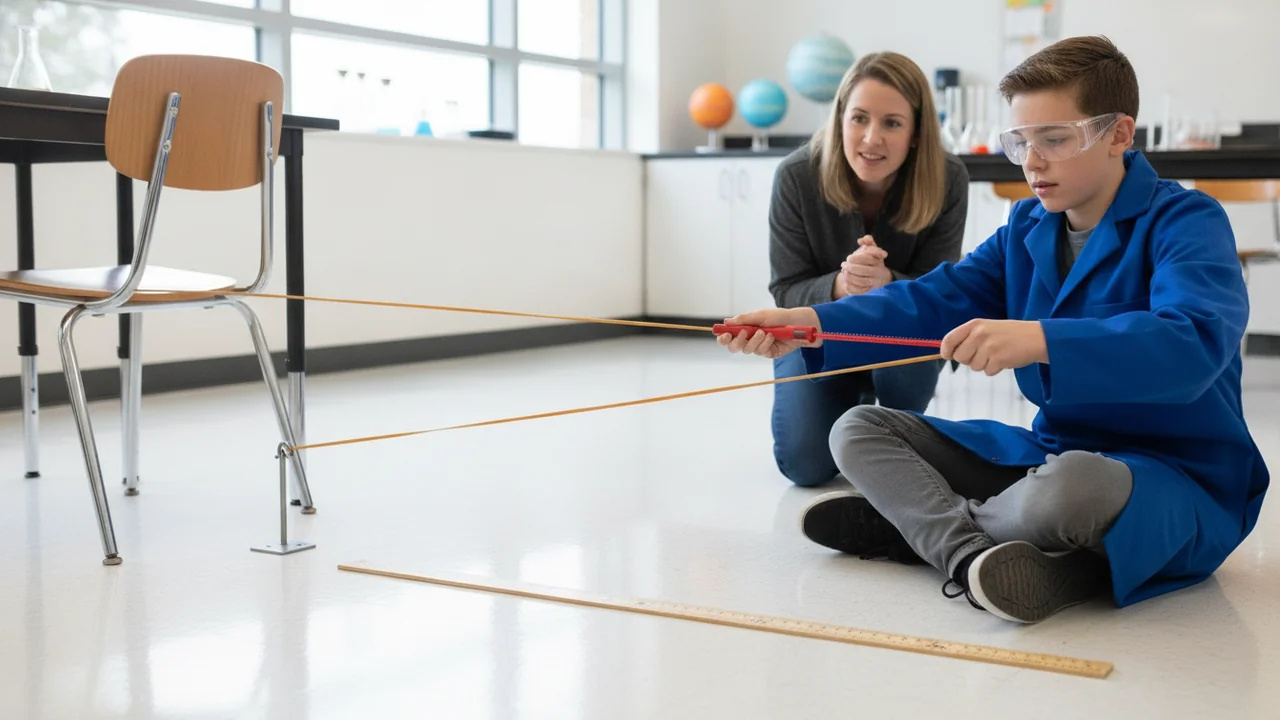
- Anchor the band between two chair legs at floor level. Pull its middle back with the spring scale in 5 cm steps to 25 cm, recording the force at each step (or hang known masses and measure stretch).
- Graph F against x and find the stored energy at 20 cm as the area under the curve, using trapezoids.
- Put the cart against the band, pull back 20 cm, and release. Film the cart crossing two tape marks 0.50 m apart just after launch and compute its speed from the frame count.
- Mass the cart. Compute its kinetic energy and the fraction of the stored energy it received. Repeat three times.
- Feel the band right after several quick stretches and releases, and note any warming.
Data table.
| Stretch x (m) | 0.00 | 0.05 | 0.10 | 0.15 | 0.20 | 0.25 |
|---|---|---|---|---|---|---|
| Force F (N) | 0.0 | 1.6 | 2.6 | 3.3 | 4.0 | 4.9 |
| Illustrative force-stretch data; record your own at the same stretches, plus three launch speeds. | ||||||
Analysis.
- Claim-evidence-reasoning: was energy conserved in the launch? Cite your stored energy, the cart’s kinetic energy and the band’s warming.
- Compare your trapezoid area with ½Fx. Which is the better estimate for a rubber band, and why?
- Estimate the uncertainty in the cart’s kinetic energy from ±1 video frame, and decide whether the energy gap is larger than that uncertainty.
Other routes to the same data. Use the illustrative force-stretch table and launch speed in the lesson, or PhET Masses and Springs (Energy screen) to see elastic, kinetic, gravitational and thermal energy bars as a mass oscillates with damping turned on.
Guided Exercises ~15 min
Use the force-stretch table and your own launch data.
Independent Practice ~10 min
Build your argument from your own launch data.
Record a 90-second argument (or write 200 words) answering the skeptic: "Energy is not conserved, because the rubber-band car stops." Name your system, use your launch data (stored energy, kinetic energy, warming) as evidence, explain the particle-scale reasoning, and state what measurement would convince you the skeptic was right. Then respond to one classmate by supporting, qualifying or challenging their argument. A written post earns equal credit.
Closure ~5 min
Energy that spreads into random particle motion is still there, just hard to use. That idea drives every efficiency number in this unit.
Exit ticket: draw two quick models of the band launch, one at the visible scale and one at the particle scale, and label where the “missing” energy is in each.
How confident are you that you can I can calculate elastic energy and argue from evidence, at the particle scale, that energy is conserved when it seems to be lost.
Teacher notes
Materials: see the lab list; spring scales or hanging masses, rubber bands of one type, toy carts, phones for video.
Timing: Poly ran this lesson over two 50-minute periods. Run the force-stretch graph and one launch in period one and the argument in period two, or let this lesson span two periods.
Listen for: “friction destroys energy”; confusing temperature with thermal energy; stretch measured in cm left unconverted.
Support / stretch: give a trapezoid template. Stretch: compare the loading and unloading curves of a band and explain the area between them.