1.08 Critique and Iterate: Gallery Walk, Criteria Test and Version 2
give and use evidence-based critique, test version 1 against every criterion, and build and measure an improved version 2.
- I can systematically and quantitatively evaluate how well my device meets the criteria and constraints.
- I can use my test results to improve my device’s energy conversion efficiency, considering the criteria, constraints, and any tradeoffs from my changes.
- I can identify and explain the scientific principles that support my device’s energy conversion design.
- I can describe the forms of energy my device converts, the energy losses to the environment, and the scientific reasons for my choices of materials and structure, including how my own evidence influenced my design.
- I can explain how my device shows that applying scientific knowledge and engineering design can increase benefits and reduce costs or risks for society.
Phase 4: Build
Warm-Up ~5 min
Do Now. Read the critique sentence starters below. Which one is hardest for you to say to a friend’s team, and why?
“I like… because your data show…” • “I wonder…” • “What if…?”
Which critique is most useful?
Instruction ~10 min
Class criteria and constraints for the exhibit converter (set in 1.02, ranked in 1.07). Criteria: (1) the final version reaches a mean efficiency of at least 50% over three trials; (2) its three trials agree within ±5 percentage points; (3) it runs 10 times in a row without repair, because visitors will use it all day. Constraints: input energy no more than 10 J (a falling mass of at most 1.0 kg dropped at most 1.0 m, or a band stretched at most 25 cm); it fits a 60 cm × 40 cm table space; class-kit or household materials only, costing at most 10 sample budget points; two build periods.
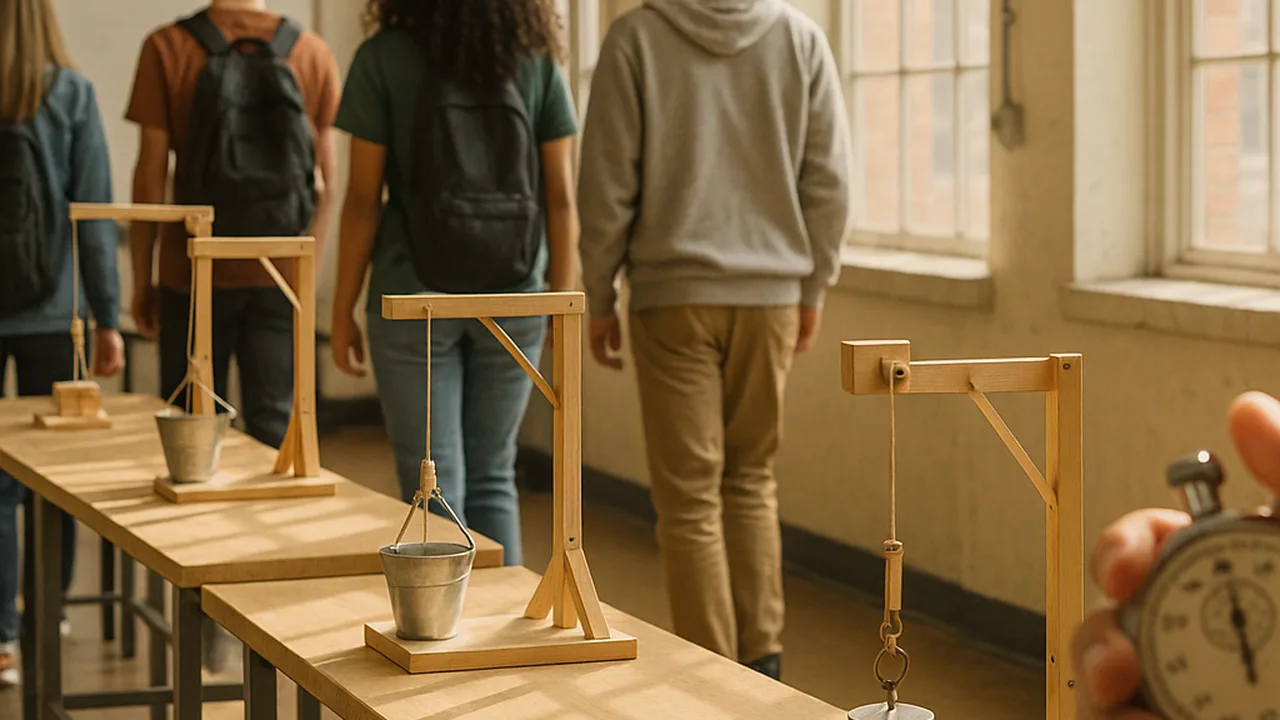
Gallery critique protocol (15 minutes). Each team leaves its device, energy-flow diagram and version 1 data at its station. Visiting teams spend three minutes per station and leave sticky notes: one “I like” tied to data, one “I wonder” about a loss or measurement, one “What if” with a specific change. The home team then sorts notes into “change now”, “test later” and “no”.
Test against every criterion. Efficiency alone is not the test. Fill in the criteria check before choosing what to change.
| Criterion or constraint | Target | Version 1 result | Met? | Version 2 result | Met? |
|---|---|---|---|---|---|
| Mean efficiency | ≥ 50% | ||||
| Trial agreement | ±5 points | ||||
| Runs without repair | 10 in a row | ||||
| Input energy | ≤ 10 J | ||||
| Footprint | 60 × 40 cm | ||||
| Cost | ≤ 10 points |
Worked example 1: choosing the change from evidence (sample data). Malik’s band car averaged 40% (trials 37, 40, 43%). Critique notes said the axle squeaked and the car drifted left. The team’s energy-flow diagram put the biggest loss at the axle. Version 2 changed only the axle: straw bearings. Result: 48% (trials 46, 48, 50%). The 8-point gain is larger than either spread, so the change is real.
Worked example 2: a trade-off. Ava’s launcher reached 52% with a thicker band, but the band tore on run 7, failing the durability criterion. The team went back to the thinner band (47%) and instead reduced loss by stretching it only 18 cm, where its F-x graph is still nearly straight and less energy goes into internal friction. They wrote: “We gave up 5 points of efficiency to pass durability, which the client weighted equally.”
Quantitative evaluation. For each version, report: input energy, mean useful output, mean efficiency, spread, and a pass/fail for each criterion. A version counts as better only if its gain is larger than the spreads.
Guided Exercises ~15 min
Use your criteria table and critique notes.
Independent Practice ~10 min
Build and test version 2, then update the iteration log.
Iteration log entry: version 2 data (three trials, mean, spread), the criteria table filled in, and a paragraph evaluating whether the change worked, the trade-off it created, and your plan for version 3.
🔎 Mini case study: From incandescent bulbs to LEDs: iterating an energy converter ~8 min
A light bulb is an energy converter: electrical energy in, light out. In an incandescent bulb, current heats a thin tungsten filament until it glows. Most of the electrical energy leaves as thermal energy and infrared radiation, not visible light, so the bulb is hot to touch.
Light-emitting diodes (LEDs) convert electrical energy to light in a different way: electrons in a semiconductor drop to lower energy levels and give off light directly. The U.S. Department of Energy states that residential LEDs, especially ENERGY STAR rated products, use at least 75% less energy than incandescent lighting for the same job and last much longer. Engineers also had to solve new problems along the way, such as getting warm white colors and removing the heat that LED electronics still produce.
Think about it: Use the idea of useful output to explain why an LED gives the same light with much less electrical energy. What new trade-offs did the switch create?
Closure ~5 min
Version 2 is tested and the log is up to date. Next: Exhibit Day, where version 3 and the defense meet the client.
Exit ticket: which critique note changed your design most, and what did your data show after the change?
How confident are you that you can I can evaluate a device against criteria with measured data and use the results to improve its efficiency.
Teacher notes
Materials: devices, sticky notes in three colors, criteria tables, spare straws, bands and string for version 2, goggles.
Setup: gallery walk 15 min, change planning 5 min, build and test 20 min, log 10 min. All numbers in worked examples are sample data.
Listen for: critiques of people instead of designs; teams changing several things at once; “it’s better” with no spread.
Support / stretch: assign each visitor a single role (efficiency checker, durability checker, diagram checker). Stretch: plot efficiency against version number with error bars from the spread.