3.08 Critique and Iterate: Gallery Critique, Criteria Test and Version 2
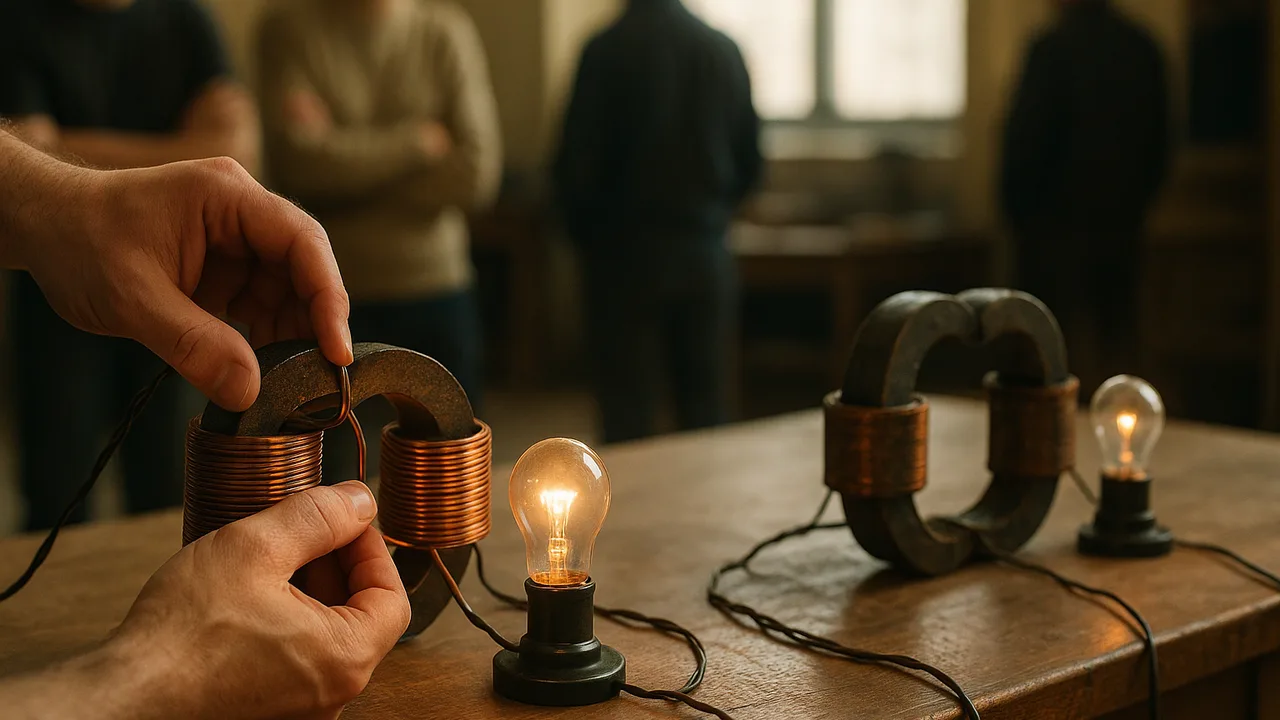
give and use evidence-based critique, test version 1 of our link against every criterion, judge when a solution’s costs outweigh its benefits, name the simulation’s limits, and build an improved version 2.
- I can interpret the results of the simulation and predict how proposed solutions will affect the systems involved.
- I can identify when a solution’s possible negative consequences outweigh its benefits.
- I can identify the limitations of the computer simulation.
Phase 4: Build
Warm-Up ~5 min
Do Now. Read the critique starters: “I like… because your data show…” • “I wonder…” • “What if…?” Write one of each for your own team’s design.
Which critique is most useful to a team?
Instruction ~10 min
Class criteria and constraints for the wind-to-town link (set in 3.02, weighted in 3.07). Criteria: (1) on our classroom-scale model (a 12 V AC source, a 10 Ω line and a 10 Ω town load) the design delivers at least 95% of the energy sent; (2) at full scale (100 MW over a 40 km line with 10 Ω of resistance) the line loses no more than 2% of the power; (3) low land and wildlife impact; (4) low wildfire and safety risk in high winds. Constraints: a budget of at most 12 sample budget points; the source voltage and the town’s load are fixed; transformer pairs come only in ratios of 1:5, 1:10 and 1:20; every number must be labeled as sourced or illustrative; two build periods.
Gallery critique (15 minutes). Each team posts its circuit screenshot, results row, matrix and predicted side effects. Visitors spend three minutes per station and leave one “I like” tied to data, one “I wonder” about an input or assumption, and one “What if” with a specific test. The home team sorts notes into “change now”, “test later” and “no”.
Test version 1 against every criterion.
| Criterion or constraint | Target | Version 1 | Met? | Version 2 | Met? |
|---|---|---|---|---|---|
| Delivered on scale model | ≥ 95% | ||||
| Full-scale line loss | ≤ 2% of 100 MW | ||||
| Land and wildlife score | as high as possible | ||||
| Wildfire and safety score | as high as possible | ||||
| Budget | ≤ 12 points |
Worked example 1: version 2 from critique (sample data). Priya’s team (design C: 1:10 pair, shorter valley route, R = 6 Ω) got the note “I wonder how much habitat the wetland crossing removes.” Version 2 bends the route around the wetland, which lengthens the line so R = 7 Ω, at +1 point. Simulator: line current 0.119 A, line loss 0.099 W, town 14.20 W, so 99.3% delivered, still above 95%. At full scale on a 230 kV line, 7 Ω loses (435 A)2(7) = 1.32 MW, or 1.3%, which passes criterion (2). The land and wildlife score rises from 2 to 4; the cost score falls from 4 to 3 (10 budget points in all, still within 12). New weighted total: 0.3(5) + 0.3(4) + 0.2(4) + 0.2(3) = 4.1.
Worked example 2: when the costs outweigh the benefits. Malik’s team argued for 500 kV at full scale. Compared with 345 kV, it cuts the loss from 0.84 MW to 0.40 MW: 0.44 MW saved, or 0.44% of the farm’s output. But it needs the tallest towers, the widest clearances along the ridge and the 1:20 pair at 6 points. Both already pass criterion (2). The team concluded that the small energy gain does not outweigh the larger wildfire, land and cost penalties for this 100 MW farm, and dropped it.
Limits of our simulation. The model uses ideal transformers (real large ones waste roughly 1% or so each), treats the line as a plain resistor (real AC lines also have inductance and capacitance), holds the town’s load constant (real demand changes by the hour), and ignores weather, which changes both wind output and a line’s temperature and resistance. Its numbers are for comparing designs under stated assumptions, not for promising exact deliveries. A good report says so.
Guided Exercises ~15 min
Use your criteria table and the gallery notes.
Independent Practice ~10 min
Build and test version 2, then update the design log.
Design log: version 2 circuit and results, the criteria table completed for both versions, one option you rejected because its negative consequences outweighed its benefits (with numbers), and three limitations of the simulation with the direction each would push your results.
🔎 Mini case study: AC beats DC for long lines: the Niagara Falls power project ~8 min
In the 1880s, the first electric systems in cities used direct current at low voltage. Because the voltage could not easily be raised, the current in the wires was large and I2R losses were severe, so power stations had to be within about a kilometer or two of their customers. Alternating current could be stepped up with transformers for the journey and stepped down for use. The rivalry between the two systems in that decade is often called the “war of the currents.”
The Niagara Falls hydroelectric project helped settle it. Its first large AC generators, built by Westinghouse using Nikola Tesla’s polyphase AC designs, began running in the mid-1890s, and in 1896 transmission lines began delivering power to Buffalo, New York, roughly 40 km away. Long-distance AC transmission with transformers soon became the standard design for electric grids around the world.
Think about it: Use I = P/V and I2R to explain why transformers made the 40 km link possible. What trade-offs did higher voltages bring that our county link still faces today?
Closure ~5 min
Version 2 is tested and every trade-off is on paper. Next: the design report and the presentation to the commission.
Exit ticket: which critique note changed your design most, and what did the simulation show after the change?
How confident are you that you can I can test a design against every criterion, judge when costs outweigh benefits and state the limits of a simulation.
Teacher notes
Materials: devices with the simulator, sticky notes in three colors, criteria tables.
Setup: gallery walk 15 min, plan 5 min, version 2 build and test 20 min, log 10 min. All costs and scores are sample values. The case study’s history is well documented; keep dates general (1880s, 1890s, 1896) and avoid extra claims.
Listen for: rejecting an option without numbers; “the simulation proves it”; changing two things at once.
Support / stretch: give each visitor one role (loss checker, impact checker, budget checker). Stretch: estimate the money value of 0.44 MW saved over a year at a sample price per kWh and compare with a sample cost difference.