4.08 Critique and Iterate: Gallery Walk and Link Version 2
give and use evidence-based critique, test version 1 against every criterion, and use the results to build and test a more reliable version 2, while explaining the cause-and-effect links that make the link work.
- I can evaluate whether answers to questions about digital transmission and storage provide ways to test if certain features are advantages or disadvantages.
- I can identify and communicate the cause and effect relationships that allow each device to function.
Phase 4: Build
Warm-Up ~5 min
Do Now. Look at your version 1 data. Which trial surprised you most? Write what happened and one possible cause.
Version 1 decoded perfectly with the lights off but misread 3 bits with the lights on. What does that suggest?
Instruction ~10 min
Gallery critique. Each team sets out its link, matrix and version 1 data. Visitors try receiving one code and leave three sticky notes: I like… (a strength tied to a criterion), I wonder… (a question about the data or the science), and What if… (one specific change). Feedback must point at evidence, not taste.
Test against the criteria. Check version 1 against every criterion and constraint, and look for unexpected effects: the sender’s rhythm drifting, two errors cancelling so parity misses them, a receiver who gets tired, or the code arriving fine at 5 m but failing at 7 m.
Worked example 1: reading the evidence (sample data). Jamal’s team used on-off flashes at 0.5 s per bit. Results: trial 1, 10 s, 0 errors; trial 2, 10 s, 1 error caught by parity, resent, 20 s; trial 3, 10 s, 2 errors not caught (parity was even again), decoded wrong. Only 2 of 3 trials met the criterion. The receiver lost count during a run of five 0s: with no flash, the pauses blurred together.
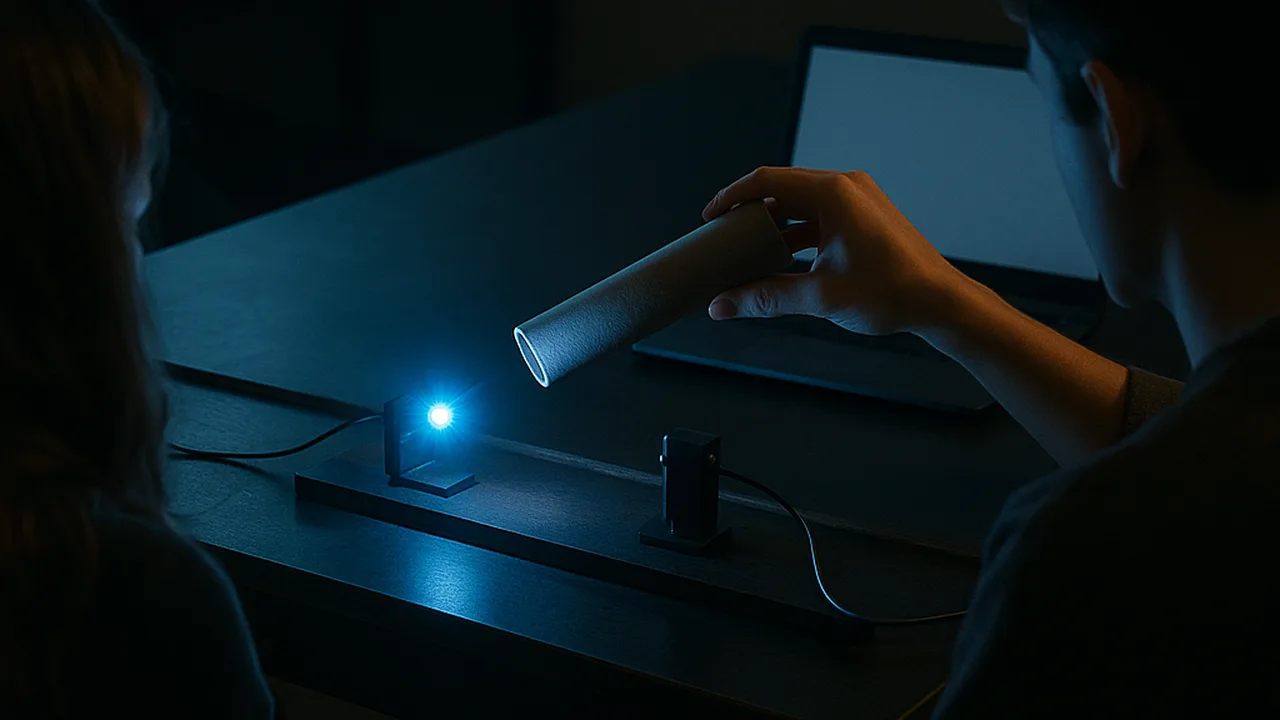
Worked example 2: an evidence-based iteration. For version 2 they switched to green = 0 and blue = 1, so every bit is a visible flash, and added a cardboard tube. They also split the code into two 8-bit halves with a parity bit each, so two errors in different halves would both be caught (one more bit, 17 bits). Version 2 (sample): 3 of 3 decoded correctly, send times 10.5, 10.5 and 21 s (one resend). The resend broke the 20 s limit, so they tried a 0.4 s beat: 17 × 0.4 + 2 = 8.8 s per send, with room for a resend. Each change answered a specific failure.
Cause and effect. As you iterate, write the chain that makes your link work: the LED converts electrical energy to light of a set color (frequency); the light travels to the receiver; the eye or the phone sensor absorbs photons and registers a signal; the decision rule turns it into a bit; the parity check tests the result. If you can name each link, you can explain the device to anyone.
| Criterion or constraint | Version 1 result | Met? | Change for version 2 | Version 2 result | Met? |
|---|---|---|---|---|---|
| 16-bit code across ≥ 5 m | |||||
| No uncorrected errors, 3 of 3 | |||||
| Send time ≤ 20 s | |||||
| Parity bit included | |||||
| LED or phone light only; no light in eyes | |||||
| Unexpected effects |
Guided Exercises ~15 min
Use your gallery notes and the version 1 table.
Independent Practice ~10 min
Build and test version 2.
Complete the version 1 / version 2 table. For each change, name the problem it solves, its cost (time, bits, materials) and the measured benefit. Then write the cause-and-effect chain that makes version 2 work.
🔎 Mini case study: Charles Kao and the glass that carries the internet ~8 min
In the 1960s, glass fibers could guide light, but the light faded after a short distance, so most engineers thought fibers were useless for long-distance communication. In 1966 the engineer Charles Kao, working with George Hockham, argued that the problem was not glass itself but impurities in it. If glass could be made pure enough, they reasoned, light could travel far enough through a fiber to carry telephone signals.
Glass makers took up the challenge, and within a few years much purer fibers were produced. Today fiber-optic cables carry a large share of the world’s telephone and internet traffic, including the data from sensor networks. Kao shared the 2009 Nobel Prize in Physics for this work on transmitting light in fibers for optical communication.
Think about it: Use total internal reflection and the idea of energy loss to explain why purer glass let light carry signals farther. How did Kao’s work change what digital transmission could do?
Closure ~5 min
Version 2 is tested. Next phase: Prove It, with the technical explainer for the client.
Exit ticket: what single change made the biggest difference between version 1 and version 2? Support it with error counts and send times.
Teacher notes
Materials: sticky notes in three colors, version 1 links and data, colored LED flashlights or filters, cardboard tubes, code cards, stopwatches.
Setup: 15 minutes gallery, 10 minutes table and plan, 20 minutes build and test version 2, 5 minutes closure. Read the case study during set-up changes.
Case study note: keep to the well-documented facts (1966 proposal with George Hockham; 2009 Nobel Prize in Physics). Do not add loss figures.
Listen for: critique about looks; changes with no data reason; “parity fixes errors” (it only detects them).
Support / stretch: give a one-change-at-a-time rule. Stretch: test the link at 5, 7 and 9 m and graph errors against distance.