2.08 Critique and Iterate: Gallery Walk and Generator Version 2
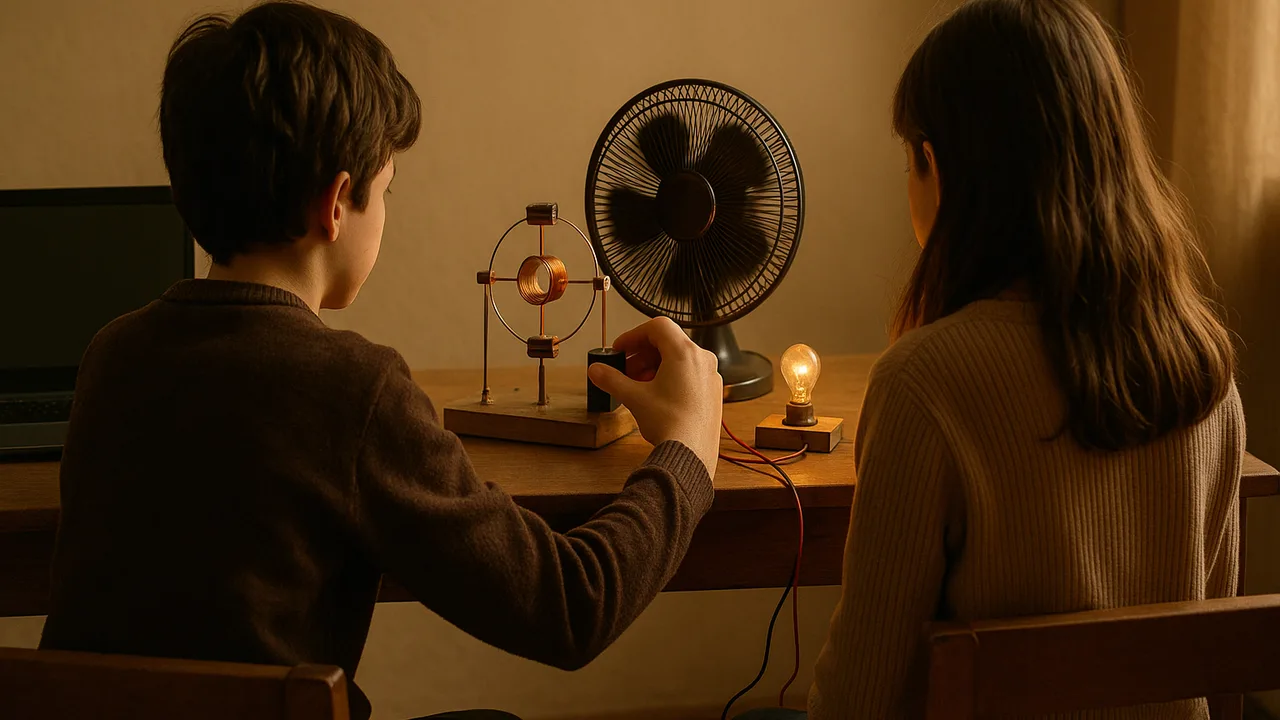
evaluate the accuracy and precision of our generator data, use critique to refine the design and the investigation plan, and build and test version 2.
- I can evaluate the accuracy and precision of my data and identify any limitations in my investigation.
- I can judge whether my data provides the evidence needed to show the relationship between electric currents and magnetic fields.
- I can refine my investigation plan to improve the accuracy, precision, and usefulness of my data so that I can clearly measure or indicate the presence of electric current and magnetic fields.
- I can measure and record electric currents and magnetic fields during my investigation.
Phase 4: Build
Warm-Up ~5 min
Do Now. Look at your three trials at one speed. Are they close together? Write the spread (largest minus smallest) and what it tells you.
Trials read 0.42, 0.61 and 0.35 V at the same speed (sample). The best description is
Instruction ~10 min
Gallery critique. Teams set out their generator, matrix, plan and data. Visitors leave three notes per station: I like… (a strength tied to a criterion), I wonder… (a question about the data or the plan), and What if… (one specific change). Each note must cite something visible in the data.
Accuracy and precision. Precision is how close repeated readings are to each other; accuracy is how close they are to the true value. A meter set to the wrong range, a hand that cranks unevenly, or a loose clip lead reduces precision. Ask: is our data good enough to show that the voltage appears only when the field changes and grows when it changes faster? If not, refine the plan.
Worked example 1: evaluating data (sample). Diego’s version 1: still = 0.00 V; 1 turn/s = 0.18, 0.22, 0.20 V; 2 turns/s = 0.31, 0.52, 0.40 V. The pattern supports the claim, but the 2 turns/s spread is 0.21 V. His team found that the cranker sped up mid-count. Limitation named, cause found.
Worked example 2: refining design and plan. For version 2 they (1) used a metronome app so the crank turned at a steady 2 turns/s, (2) clipped the leads with alligator clips instead of holding them, (3) moved the coil 5 mm closer to the magnets, and (4) rewound to 300 turns, still under 30 m of wire. Version 2 (sample): 2 turns/s = 0.63, 0.66, 0.64 V; still = 0.00 V. Higher voltage, and a spread of only 0.03 V. Each change answered a specific weakness.
Energy check. Connect an LED or small bulb and crank again: it is harder to turn. The energy you supply goes through the field into the circuit, so the change in field energy matches the energy the moving parts lose and the circuit gains.
| Criterion or constraint | Version 1 result | Met? | Change for version 2 | Version 2 result | Met? |
|---|---|---|---|---|---|
| Hand crank or fan | |||||
| ≥ 0.50 V peak | |||||
| Visible magnet, coil, meter | |||||
| ≤ 30 m wire, kit magnets | |||||
| Fits 30 cm cube | |||||
| No sharp ends, no loose magnets |
Guided Exercises ~15 min
Use your gallery notes and data.
Independent Practice ~10 min
Build, test and record version 2.
Complete the version 1 / version 2 table. For each change, name the weakness it addressed, the evidence it worked, and one remaining limitation of your data.
🔎 Mini case study: Regenerative braking: one machine, two jobs ~8 min
Electric and hybrid cars, and many electric trains, use a technique called regenerative braking. When the driver accelerates, the battery sends current through the motor’s coils, and the magnetic field turns the wheels: electrical energy becomes kinetic energy. When the driver brakes, the system switches the same machine to work as a generator. The turning wheels spin the rotor, the changing magnetic field induces a current, and that current charges the battery.
The induced current’s field pushes back on the rotor, which is exactly what slows the vehicle. So part of the kinetic energy that ordinary brakes would turn into heat in brake pads is stored again as chemical energy in the battery. Regenerative braking cannot recover all of it, and vehicles still carry ordinary friction brakes for hard stops.
Think about it: Use the field model to explain why the push-back of the induced current both slows the vehicle and charges the battery. Why can’t all the kinetic energy be recovered?
Closure ~5 min
Version 2 is tested and our plan is sharper. Next phase: Prove It, with the visitor-center explainer.
Exit ticket: which change between versions improved your data the most, and how do you know?
Teacher notes
Materials: sticky notes in three colors, version 1 generators, metronome apps or a classroom metronome, alligator-clip leads, extra wire, LEDs, multimeters.
Setup: 15 minutes gallery, 10 minutes evaluation and plan, 20 minutes build and retest, 5 minutes closure. Read the case study while glue or tape sets.
Listen for: confusing accuracy with precision; changes made with no data reason; LEDs wired backwards (they only conduct one way, so try both).
Support / stretch: give a spread calculator table. Stretch: estimate percent uncertainty for each speed and graph voltage against speed with error bars.