3.08 Critique and Iterate: Gallery Walk and Oven Version 2
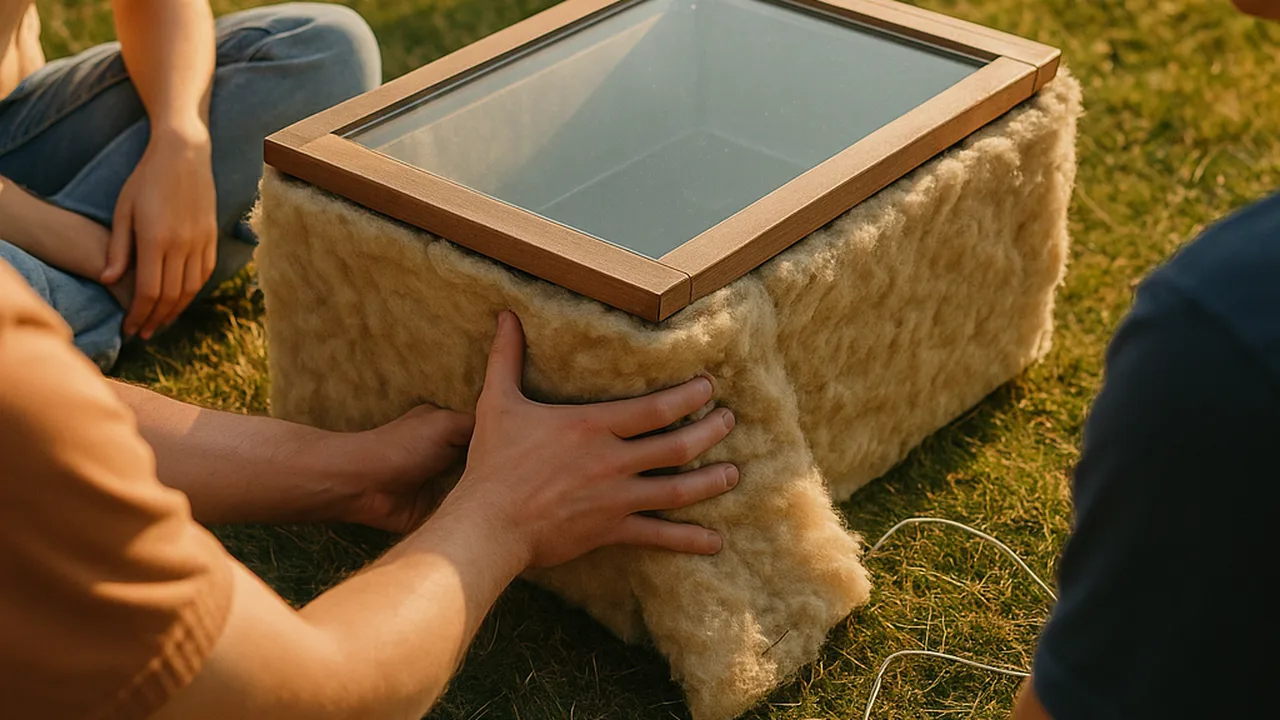
give and use evidence-based critique, evaluate version 1 quantitatively against every criterion and constraint, and use the results to build and test a more efficient version 2.
- I can systematically and quantitatively evaluate how well my device meets the criteria and constraints.
- I can use my test results to improve my device’s energy conversion efficiency, considering the criteria, constraints, and any tradeoffs from my changes.
Phase 4: Build
Warm-Up ~5 min
Do Now. Look at your version 1 data. Which reading surprised you most? Write what happened and one possible cause.
Version 1 heated the water quickly for 15 minutes, then the temperature leveled off. What does the energy model suggest?
Instruction ~10 min
Gallery critique. Each team sets out its oven, matrix and version 1 data. Visitors leave three sticky notes per station: I like… (a strength tied to a criterion), I wonder… (a question about the data or the science), and What if… (one specific change). Feedback must point at evidence, not taste.
Evaluate systematically and quantitatively. Before redesigning, score version 1 against every criterion and constraint with numbers, and look for unexpected effects: condensation fogging the window, the plastic film sagging, the flap blowing shut in the wind, or the temperature leveling off early.
Worked example 1: reading the evidence (sample data). Malik’s team measured version 1: build time 24 min, opening 0.090 m2, water 21 → 40 °C (rise 19 °C), control rise 4 °C, efficiency 200 × 4.18 × 19 ÷ 162,000 = 9.8%. The window fogged after 10 minutes. Fog scatters and reflects light, so less light reached the black floor. The failure is data: it points to a specific fix.
Worked example 2: an evidence-based iteration. For version 2 they covered the water container with a clear lid so the water’s vapor stayed inside it, and they added a second, inner layer of plastic film with a small air gap between the layers to slow loss through the window. Version 2 (sample): build time 28 min, water 21 → 45 °C (rise 24 °C), efficiency 200 × 4.18 × 24 ÷ 162,000 = 12.4%. Each change answered a specific problem, and they checked that the build time stayed under 30 minutes.
Weighing cost and benefit. Every change costs something: materials, build time or ease of use for a family. Ask: does this change buy enough efficiency to be worth its cost? Write the trade-off down.
| Criterion or constraint | Version 1 result | Met? | Change for version 2 | Version 2 result | Met? |
|---|---|---|---|---|---|
| Rise ≥ 20 °C in 30 min | |||||
| Efficiency ≥ 10% | |||||
| Family build < 30 min | |||||
| Materials, foil ≤ 1 m2, no glass | |||||
| One person can carry it; mitt only | |||||
| Unexpected effects |
Guided Exercises ~15 min
Use your gallery notes and the version 1 table.
Independent Practice ~10 min
Build and test version 2.
Complete the version 1 / version 2 table. For each change, name the energy loss it targets, its cost (materials, build time, ease of use) and the measured change in temperature rise and efficiency.
🔎 Mini case study: The vacuum flask: solving the keep problem ~8 min
In 1892 the Scottish scientist James Dewar needed to keep liquefied gases, which are extremely cold, from warming up while he studied them. His solution was a container with two glass walls and the air pumped out of the space between them. With almost no particles in the gap, thermal energy could not cross it by conduction or by moving air. Silvering the walls reflected much of the thermal radiation as well.
The same design works in both directions: it slows energy flowing in to a cold liquid and flowing out of a hot one. Companies later sold it for keeping drinks hot or cold, and today’s insulated bottles still use a vacuum between two walls. No flask is perfect: energy still leaks slowly through the neck and the lid, which is why a drink cools over many hours rather than minutes.
Think about it: Use the second law and the idea of energy flows to explain why removing the air between two walls slows thermal energy transfer. Which part of a flask’s design could a family copy cheaply in a solar oven, and what would it cost them?
Closure ~5 min
Version 2 is tested. Next phase: Prove It, with the full design report and a spreadsheet model.
Exit ticket: what single change made the biggest difference between version 1 and version 2? Support it with the temperature rise and efficiency of each.
Teacher notes
Materials: sticky notes in three colors, version 1 ovens and data, extra plastic film, clear container lids, tape, thermometers, timers, oven mitts.
Setup: 15 minutes gallery, 10 minutes table and plan, 20 minutes build and start the version 2 test, 5 minutes closure. Read the case study during the 30-minute test.
Case study note: keep it qualitative. Dewar’s 1892 vacuum flask is well documented; do not add dates or company names beyond what is given.
Listen for: critique about looks; version 2 changes with no data reason; changes that break the build-time or materials constraints.
Support / stretch: give a one-change-at-a-time rule. Stretch: graph temperature against time for both versions and estimate the steady-state temperature for each.