3.06 One Energy Model: CER, Model Revision and Oven Ideas
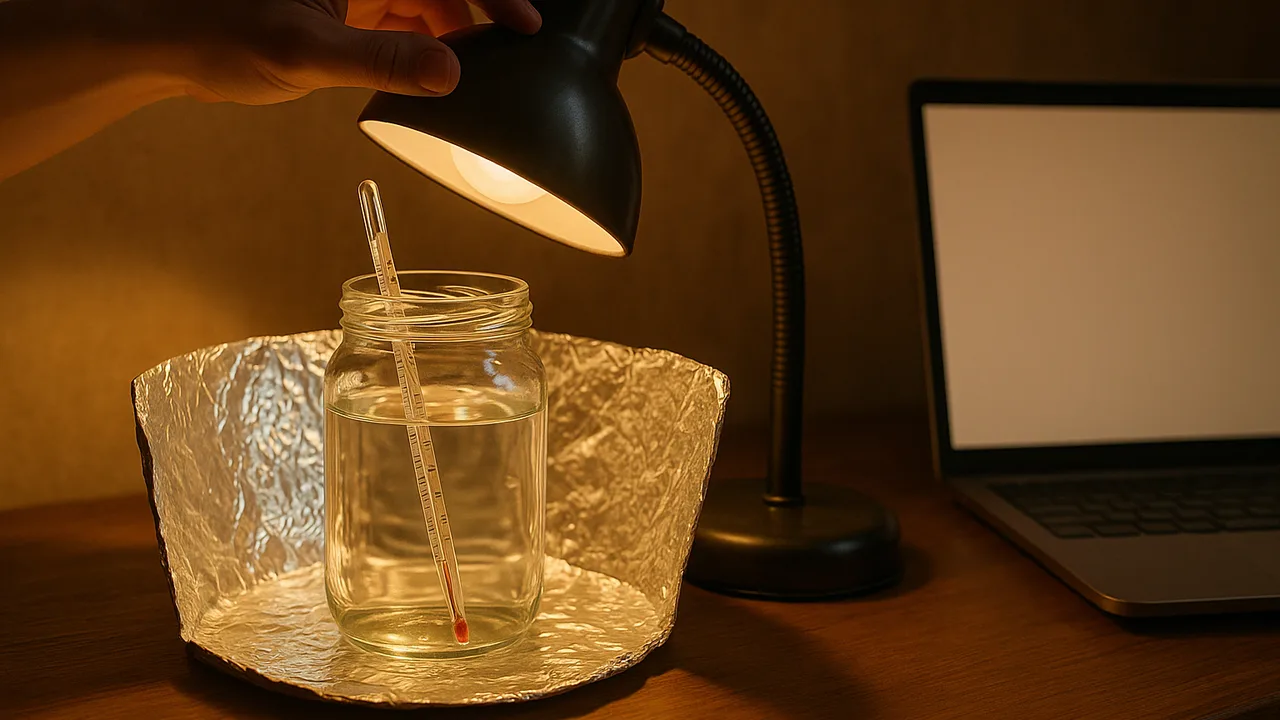
combine the unit’s evidence into one energy-flow model at the large and particle scales, defend it with a claim-evidence-reasoning argument, revise the investigation plan, and brainstorm oven improvements grounded in the science.
- I can develop models that identify and describe all parts of a system and its surroundings, showing how energy flows between them.
- I can clearly represent both macroscopic (large-scale) and molecular/atomic (small-scale) views of a system in my models.
- I can show in my models how energy appears in different forms at both the macroscopic scale (like motion, sound, light, thermal energy, potential energy, or energy in fields) and the molecular/atomic scale (like kinetic energy of particles, potential energy from positions in fields, and energy in fields).
- I can use my models to show that in closed systems, energy is conserved at both the macroscopic and molecular/atomic scales, so that as one form of energy changes, the total energy stays constant, as shown by other forms of energy changing by the same amount or only by the energy transferred into or out of the system.
- I can revise my investigation plan to improve the accuracy, precision, and usefulness of my data if needed.
Phase 3: Make Sense
Warm-Up ~5 min
Do Now. List one piece of evidence from each of the last three labs (mixing water, bouncing balls, the oven) that energy was transferred out of the part you were watching.
What do the mixing lab, the bouncing ball and the solar oven have in common?
Instruction ~10 min
One model for the whole unit. Three labs, one idea: in a closed system, the total energy stays constant. When one store goes down, others go up by the same amount, or energy crosses the boundary. Today you build one model that explains all three labs and the pumped-storage plant, then use it to plan better ovens.
Two scales in one model. At the large scale, draw stores (kinetic, gravitational, thermal) as boxes and transfers as arrows labeled with joules. At the particle scale, show what thermal energy is: particles moving faster and pulling on each other harder. A good model links the two. When the bouncing ball hits the floor, ordered motion of the whole ball becomes faster random motion of the particles in the ball and floor. When light is absorbed by black paper, the paper’s particles jiggle faster, and those fast particles pass energy to the air and water by collisions.
Worked example 1: an energy bar model (sample numbers). Ava’s oven took in 162,000 J of light in 30 minutes. Her bars: water +16,700 J; container and black paper +9,000 J (estimated from their mass); air and box walls +14,000 J (estimated); reflected back out through the window, about 40,000 J (estimated); lost through walls and gaps to the outside air, the rest. Her estimates did not add up exactly, so she listed the largest unmeasured flow, loss through gaps, as the one to measure next. A model that shows where energy might be is more useful than one that pretends every joule is measured.
Worked example 2: a CER that uses the model. Claim: the water in our oven gained only about 10% of the light energy because most of the energy ended up as thermal energy of the box, air and surroundings. Evidence: the water gained 16,720 J of 162,000 J; the oven air was 25 °C warmer than the room; the mixing lab showed energy leaving the cups even with lids. Reasoning: energy is conserved, and thermal energy spreads from hotter objects to colder ones (the second law), so a hot box keeps losing energy to cooler surroundings until something stops the flow.
Revising the investigation. Good investigators improve their methods. The mixing lab lost energy to the cups; the oven test depends on clouds and aim. Ask: what would make the data more accurate (closer to the true value) and more precise (repeatable)? Examples: lids and nested cups, a probe that logs every 30 s, testing all teams at the same time of day, and re-aiming on a schedule.
Sentence starters. “Our model shows energy moving from ___ to ___ because ___.” “At the particle scale, this means ___.” “The evidence that energy was conserved is ___.” “Our model’s biggest assumption is ___.”
Ideate. Brainstorm at least six oven improvements, two for each sub-problem (collect, absorb, keep). For each, write the energy flow it changes and how you would measure the effect. Wild ideas are welcome at this stage; we choose in Phase 4.
| Sub-problem | Idea | Energy flow it changes | How we would measure it | Constraint check |
|---|---|---|---|---|
| Collect | ||||
| Collect | ||||
| Absorb | ||||
| Absorb | ||||
| Keep | ||||
| Keep |
Guided Exercises ~15 min
Build the model with your team, then test it with these questions.
Independent Practice ~10 min
Finish the model and the idea table.
Draw your final energy-flow model of the oven at both scales, with joules on every arrow you measured and “est.” on every one you estimated. Then fill the Ideate table with six ideas.
Name one way you would revise the mixing lab or the oven test to make the data more accurate or precise, and explain why it reduces energy losses or error.
Closure ~5 min
One model explains every lab in the unit. Next phase: build, test and improve competing oven designs.
Exit ticket: circle your team's two best ideas and explain, with the energy model, why each should raise the oven's efficiency.
How confident are you that you can model energy at large and particle scales and use it to argue where energy goes?
Teacher notes
Materials: chart paper and markers for models, each team’s data from 3.03–3.05, idea-table copies, sticky notes for the idea wall.
Setup: 10 minutes model, 15 minutes CER, 10 minutes investigation revision, 15 minutes Ideate. Post every team’s best two ideas on the idea wall for 3.07.
Listen for: models with arrows but no joules; “heat rises” used to explain all losses; confusing accuracy and precision.
Support / stretch: give a pre-drawn bar model with blank labels. Stretch: estimate the energy taken by the container and paper with Q = mcΔT and a specific heat of about 0.9 J/(g·°C) for aluminum or 1.3 J/(g·°C) for paper (approximate values).