4.10 Unit 4 Checkpoint: Group Behavior, Allele Frequencies and Drift
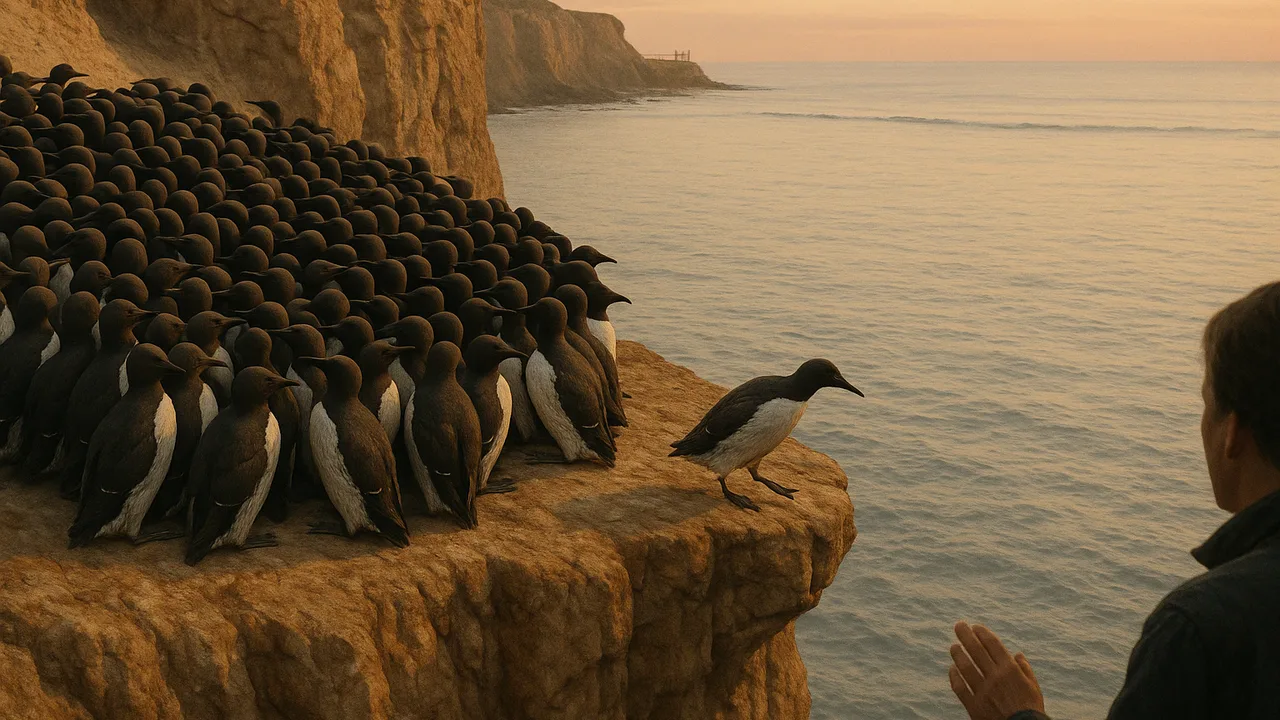
show what I learned about how group behavior affects survival and reproduction and how statistics reveal changes in a population’s traits and alleles, using data questions and constructed responses.
- I can evaluate how well the evidence supports a causal claim that group behavior gives a survival advantage, including whether it shows cause and effect or just correlation, and compare survival rates of individuals in groups versus alone.
- I can use basic statistics and probability to analyze data and identify patterns in how traits change in a population over time.
- I can compare trait distributions across different time periods or populations using statistical and graphical methods.
- I can use data analysis to explain how having a certain trait affects an organism’s chances of surviving and reproducing.
- I can use evidence from trait distribution changes to argue that natural selection causes increases or decreases in heritable traits when those traits impact reproductive success.
- I can explain how adaptations in anatomy, behavior, or physiology change in a population by analyzing shifts in trait distributions.
Phase 5: Prove It
Warm-Up ~5 min
Do Now. Back to our phenomenon: a hunted-down population of elephant seals grew back to hundreds of thousands, yet has little genetic variety. In two sentences, explain why, using bottleneck and drift.
In Hardy-Weinberg equilibrium, the dominant allele always becomes more common over time.
Instruction ~10 min
Biologists, this is the unit checkpoint. Part A is multiple choice with data and a scenario set where several questions share one situation. Part B is short constructed responses, each scored 0 to 3. Read each question twice and show your work.
How a 0–3 answer is scored. 3: a correct claim, accurate evidence or calculation, and reasoning that links them with a science idea. 2: a correct claim with evidence but weak or missing reasoning. 1: a partly correct claim or evidence only. 0: incorrect or blank.
Worked example: from 1 to 3. Question: “Do pill bugs prefer damp places?” “Yes, more went to the damp side” earns 1. Ava wrote: “Yes (claim). 72 of 100 observations were on the damp side; χ2 = 19.36, above the critical value of 3.84 (evidence). So the split is very unlikely to be chance, and moving to damp places reduces water loss through the exoskeleton, which helps survival (reasoning).” That earns 3.
Scenario set for questions 5–8 (sample data). A seabird nests in dense colonies on a rocky island. Gulls steal eggs and chicks. Biologists compared nests in the colony center, at the colony edge, and pairs nesting alone outside the colony.
| Nest location | Nests | Chicks fledged | Gull attacks per nest per week |
|---|---|---|---|
| Colony center | 200 | 144 | 0.3 |
| Colony edge | 200 | 82 | 1.4 |
| Solitary pairs outside the colony | 50 | 15 | 2.1 |
Data for questions 11–13 (sample data). Small lake fish vary in spine length, and spine length is inherited. A predatory fish that has trouble swallowing long-spined prey was introduced to three lakes; three similar lakes were left without it.
| Generation | Lakes with a new predator: proportion long-spined (mean of 3) | Lakes without: proportion long-spined (mean of 3) |
|---|---|---|
| 0 | 0.20 | 0.20 |
| 2 | 0.35 | 0.18 |
| 4 | 0.52 | 0.23 |
| 6 | 0.66 | 0.19 |
Guided Exercises ~15 min
Part A: answer on your own. Your teacher reviews answers after everyone finishes.
Independent Practice ~10 min
Part B: constructed responses, each scored 0–3.
14. Explain how colony nesting can increase a seabird's chance to survive and reproduce. Identify the evidence in the table that supports your explanation, and describe one additional piece of evidence you would collect. (0–3)
15. Evaluate the seabird evidence: compare survival of nests in the colony with solitary pairs using numbers, judge its strengths and weaknesses, and decide whether it shows that group nesting CAUSES higher survival or only a correlation. (0–3)
16. Organize the spine data in a graph. Describe what each dataset shows, and use a statistic (for example, a chi-square comparing 66 long-spined fish of 100 in a predator lake with the 19 of 100 expected from lakes without the predator) to argue that the change is not chance. (0–3)
17. Use the spine data to explain how having a trait affects survival and reproduction and shifts the trait distribution by natural selection. Then explain why a population with very low genetic variation, like the northern elephant seal, might respond less well to a new predator or disease. (0–3)
Closure ~5 min
Biology II complete. You can now explain how ecosystems, evolution and behavior shape the populations around us, with evidence and mathematics.
Exit ticket: which idea from this unit are you most confident about, and which do you want to review?
How confident are you that you can explain group behavior and changes in allele frequencies with evidence and statistics?
Teacher notes
Answer key, Part A: 1 C (0.70); 2 B (168); 3 0.4 and 48; 4 B (0.82); 5 0.72, 0.41, 0.30; 6 A; 7 A; 8 A; 9 B; 10 A; 11 A; 12 A; 13 False.
Coverage: HS-LS2-8: questions 5–10, 14 and 15 (explain group behavior, identify evidence, additional evidence, evaluate validity and reliability, cause versus correlation, groups versus alone). HS-LS4-3: 1–4, 11, 12, 13, 16 and 17 (organize and describe data, statistics and probability, trait effects on survival and shifts in distribution).
Scoring Part B (0–3): 3 = claim + accurate data or calculation + reasoning with a science idea; 2 = claim + evidence, weak reasoning; 1 = partial; 0 = incorrect or blank. Question 16 model: χ2 = (66 − 19)2/19 + (34 − 81)2/81 = 2,209/19 + 2,209/81 ≈ 116.3 + 27.3 ≈ 143.6, far above 3.84. Question 9: (82 + 82) ÷ 50 = 2.56.
Support: allow a formula card (p + q = 1; p2 + 2pq + q2 = 1; χ2; 1 − 1/2N) and read-aloud for any student whose plan allows it; the scenario tables may be printed separately.