3.08 Critique and Iterate: Gallery Critique, Visitor Test and Version 2
give and use peer critique, test our exhibit station with visitors and statistics, use trait-distribution data to explain adaptation, and revise the station into version 2.
- I can use data analysis to explain how having a certain trait affects an organism’s chances of surviving and reproducing.
- I can use evidence from trait distribution changes to argue that natural selection causes increases or decreases in heritable traits when those traits impact reproductive success.
- I can explain how adaptations in anatomy, behavior, or physiology change in a population by analyzing shifts in trait distributions.
- I can use evidence to explain how biotic and abiotic factors in ecosystems can change gene frequencies in populations through natural selection.
- I can explain how an increase in the frequency of a gene leads to more individuals in a population showing a particular trait over generations.
- I can use reasoning and evidence to show how natural selection leads to populations becoming adapted to their environment through the spread of advantageous traits.
Phase 4: Build
Warm-Up ~5 min
Do Now. Read two pieces of feedback: (1) “Cool game.” (2) “I like that visitors hunt the prey. I wonder whether they notice the survivors reproduce. What if the board showed the proportion after each round?” Which helps more, and why?
Which feedback follows the “I like, I wonder, what if” protocol best?
Instruction ~10 min
Gallery critique. Teams set up version 1. Visitors leave sticky notes in three colors: I like…, I wonder…, What if…. Every note must point to a panel, a model or a criterion.
The visitor test. Each station is tested with 20 visitors (classmates from other teams and invited guests). Before and after a 3-minute visit, each visitor answers: Why did blotched salamanders become common in the inland forests? The Evidence Lead scores each answer.
Worked example 1: a test result (sample data). Team Malik’s Predator Game: before, 6 of 20 correct (0.30) and 11 of 20 used need-based language (0.55). After, 13 of 20 correct (0.65) and 5 of 20 used need-based language (0.25). The station meets the 60% target and the 25-point rise (+35 points). Then the stress test: real museum visitors often spend about 90 seconds at a station (sample assumption). With a 90-second visit, only 9 of 20 answered correctly (0.45). The design fails under realistic conditions.
Worked example 2: version 2. Team Malik noticed that 90-second visitors played one round and left before the “offspring” step. Version 2 adds a flip panel showing the proportion after each round and a running bar graph that fills in as visitors play. Retest: 12 of 20 correct (0.60) at 90 seconds. Their explanation changed too: “We used to think playing the game was enough. The test showed visitors need to see the trait distribution change across generations.”
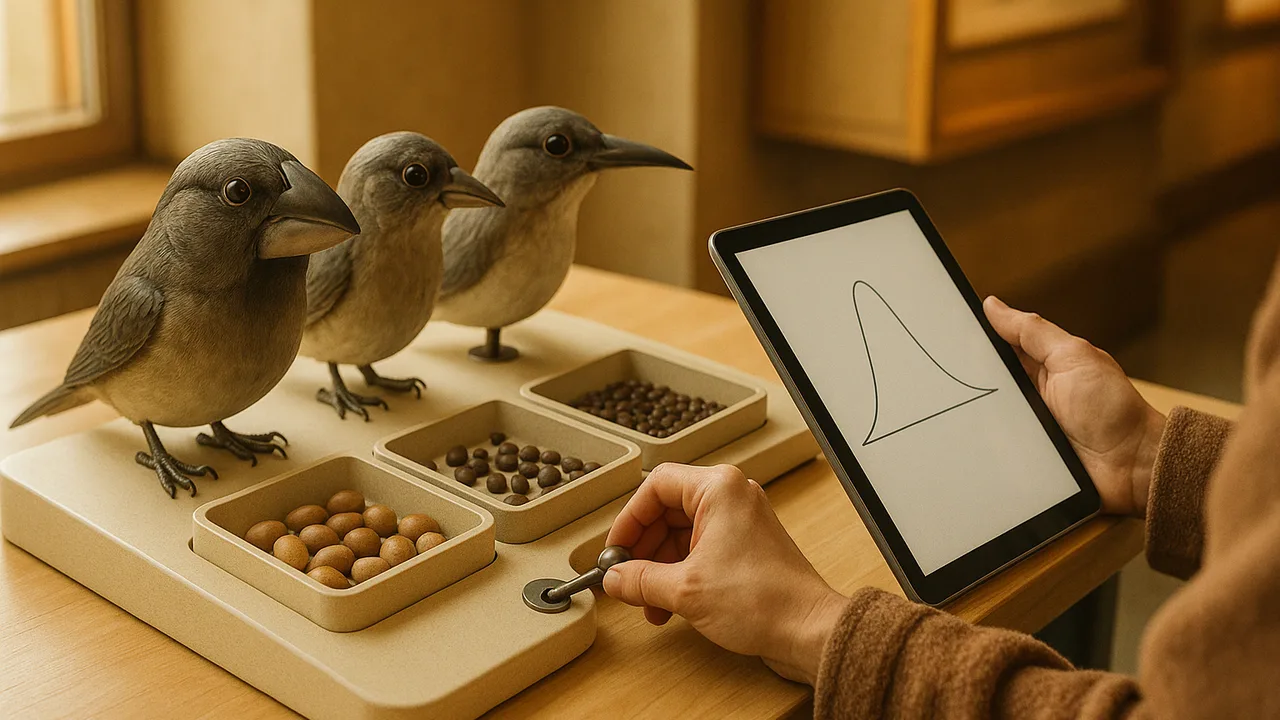
Trait distributions, not single animals. HS-LS4-3 asks you to explain adaptation from shifts in a population’s trait distribution. A histogram of beak depths, wing lengths or pattern scores before and after a selective event shows whether the average moved and whether the spread changed. The case study below is the most famous real example.
Guided Exercises ~15 min
After the gallery walk, analyze the data and revise.
Independent Practice ~10 min
Version 2.
Write your change log: two pieces of feedback you used, what you changed, and the new visitor-test result.
Using the finch case, explain how a change in the environment shifted a trait distribution through natural selection and led to a population better adapted to that environment. Use the words variation, survival, heritable and generation.
🔎 Mini case study: The finches of Daphne Major ~8 min
Since 1973, Peter and Rosemary Grant studied the medium ground finches on Daphne Major, a tiny island in the Galápagos, measuring and banding nearly every bird. In 1977 a severe drought cut the island’s seed supply. Small, soft seeds ran out first, leaving mostly large, hard seeds that only birds with deeper, stronger beaks could crack. Most of the island’s medium ground finches died. The survivors had, on average, deeper beaks than the population before the drought, and the offspring hatched after the drought inherited deeper beaks too. The Grants had measured natural selection and evolution in a wild population within a few years, and their decades of records later showed beak size shifting in different directions as rainfall and food changed.
Think about it: How is the finch drought like the dot lab, and what can the finch data show that the dot lab cannot?
Closure ~5 min
Version 2 is tested and explained. Next: the Prove It showcase for the museum team.
Exit ticket: what is the single most important change between your version 1 and version 2, and what evidence caused it?
How confident are you that you can use trait-distribution data and test results to explain adaptation and improve a design?
Teacher notes
Materials: version 1 stations, sticky notes in three colors, visitor-test score sheets, a timer for the 90-second stress test.
Case study check: the Grants’ long-term study of Daphne Major and the 1977 drought are widely documented (for example in Jonathan Weiner’s book The Beak of the Finch). The 10-bird beak data in the practice are sample numbers, not the Grants’ data.
Listen for: vague feedback; “the finches grew bigger beaks” (individual change); teams hiding a failed stress test.
Support / stretch: give sentence starters for each note color and a bar-graph template. Stretch: draw before and after histograms of the sample beak data and describe the change in mean and spread.