2.05 Fire in the Forest: Testing Solutions With Simulations and Prototypes
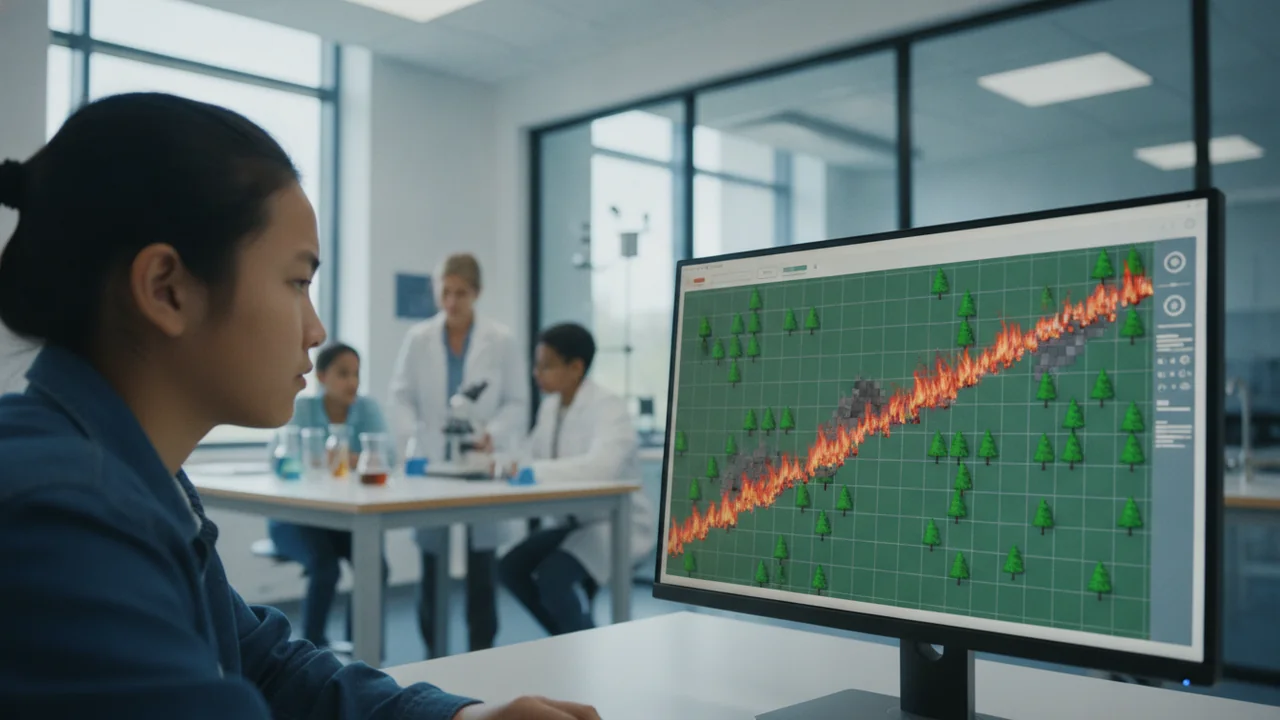
run and revise a computer simulation to test how reducing forest fuel density changes fire spread, and build and test a physical prototype for controlling erosion after a fire.
- I can create or revise a simulation that models how a specific human activity affects a threatened or endangered species or the genetic variation within a species.
- I can use my simulation to provide quantitative data about how different solutions impact threatened or endangered species.
- I can explain which variables in my simulation can be changed to test different solutions, tradeoffs, or decisions.
- I can identify the limitations of my simulation.
Phase 3: Make Sense
Warm-Up ~5 min
Do Now. Some trees in fire-adapted forests have bark more than 30 cm thick, and some cones only open after heat. Why would a tree evolve features that need fire?
In a grid model of a forest, fire spreads to any neighboring tree. What happens as you raise tree density from 50% to 70%?
Instruction ~10 min
Fire belongs here. Many forests evolved with fire. Some conifers have thick, fire-resistant bark, and low-intensity fires clear the forest floor, help release seeds from cones and expose the bare mineral soil seedlings need. For thousands of years, lightning and the burning practices of Indigenous peoples kept many forests open. A century of putting out every fire let small trees and dead wood build up. Now fires can climb into the crowns of big trees and kill trees that survived many earlier fires. The problem is not fire itself but a change in the fire regime.
Not every ecosystem needs more fire. Some fire-prone shrublands burn naturally only at long intervals. When fires come too often, often started by people, shrubs cannot re-establish, and non-native grasses take over. A good solution depends on the ecosystem, which is why engineers break a large problem into smaller, specific ones (HS-ETS1-2).
Testing an idea with a simulation (HS-LS4-6). The NetLogo Web Fire model fills a grid with trees at a chosen density and sets fire to the left edge. Fire spreads from a burning tree to any neighboring tree. Below a threshold density, around 59% in this model, fires usually die out after burning a small fraction of the forest; above it, they usually sweep across. A small change near the threshold makes a large change in the outcome. That suggests a solution to test: reduce density by thinning and prescribed burning.
Parts of a simulation. Every simulation has components (trees, fire, empty ground), rules (fire spreads to neighbors), inputs you can change (density, a fuel break) and outputs you measure (percent burned). The human activity here is fire management; the biodiversity factor is how much forest survives. The model is too simple to prove anything, and a strong engineer says so: it has no wind, slope, moisture or tree size. Revising the simulation means adding or changing a rule to make it more realistic, then asking whether the conclusion still holds.
Testing an idea with a prototype. After a severe fire, burned slopes lose the plants and litter that held soil. The first heavy rain can wash ash and soil into streams, smothering fish eggs and filling reservoirs. Land managers spread straw mulch or lay straw rolls (wattles) across slopes to slow runoff.
Prototype procedure.
- Pack three identical trays (or cut-open milk cartons with a spout) with the same mass of soil and prop all three at the same angle, about 20°. Leave one bare (control).
- Cover the second tray with a measured mass of straw or dry grass; lay two small straw wattles across the third, pressed into the soil.
- Pour 1 L of water from the same height over each tray in about 30 seconds and collect all the runoff.
- Filter each runoff sample through a weighed coffee filter, let it dry overnight, and weigh the soil lost.
- Repeat the storm once more on each tray and total the losses.
- Calculate the percentage reduction in soil loss for each treatment against the control.
| Tray | Treatment | Soil lost, storm 1 (g) | Soil lost, storm 2 (g) | Total (g) | % reduction vs control |
|---|---|---|---|---|---|
| A | Bare (control) | — | |||
| B | Straw mulch | ||||
| C | Wattles |
Worked example (illustrative test). Two storms per tray: bare control 245 g then 175 g (total 420 g); straw mulch 58 g then 37 g (95 g); wattles 95 g then 65 g (160 g). Mulch reduced soil loss by (420 − 95) ÷ 420 ≈ 77%; wattles by (420 − 160) ÷ 420 ≈ 62%. Mulch performed best here, but a full evaluation also weighs cost, how easily each can be spread on steep ground, and whether straw brings in weed seeds (HS-ETS1-3).
Guided Exercises ~15 min
Run the simulation, then analyze the prototype data.
Independent Practice ~10 min
Evaluate both tests.
Describe your simulation: its components, which parts represent the human activity and the biodiversity factor, which variables you changed, and how your results compared with what you expected. Name two limitations and whether you have enough information to recommend thinning.
Evaluate straw mulch and wattles against three criteria and constraints: effectiveness, cost of materials per square meter, and ease of applying on a steep, burned slope. Identify two ways your tray is unlike a real hillside and propose one change to your prototype.
Closure ~5 min
Simulations and prototypes test ideas before they are built at full scale. Next: we pull the unit’s science together and brainstorm solutions.
Exit ticket: name one rule you would add to the Fire model to make it more realistic, and predict how it would change the threshold.
How confident are you that you can use and revise a simulation and a prototype test to evaluate a solution for protecting biodiversity?
Teacher notes
Timing: two 50-minute periods: day one for the simulation and tray set-up, day two (after drying overnight) for weighing and evaluation.
Materials: three trays or milk cartons per group, garden soil, straw or dry grass clippings, string, a watering can or perforated cup, a 1 L jug, collection containers, coffee filters, a kitchen scale, goggles, devices for NetLogo Web.
Options: students without materials use the illustrative test numbers; students without internet use the paper grid or the recorded output.
Listen for: “all fire is bad”; treating a model result as proof; forgetting the control tray.
Support / stretch: give a pre-made graph grid. Stretch: add a wind rule so fire spreads to the east neighbor with higher probability, and describe how the threshold moves.