1.09 Showcase: What Limits the Herd? The Herd Health Plan
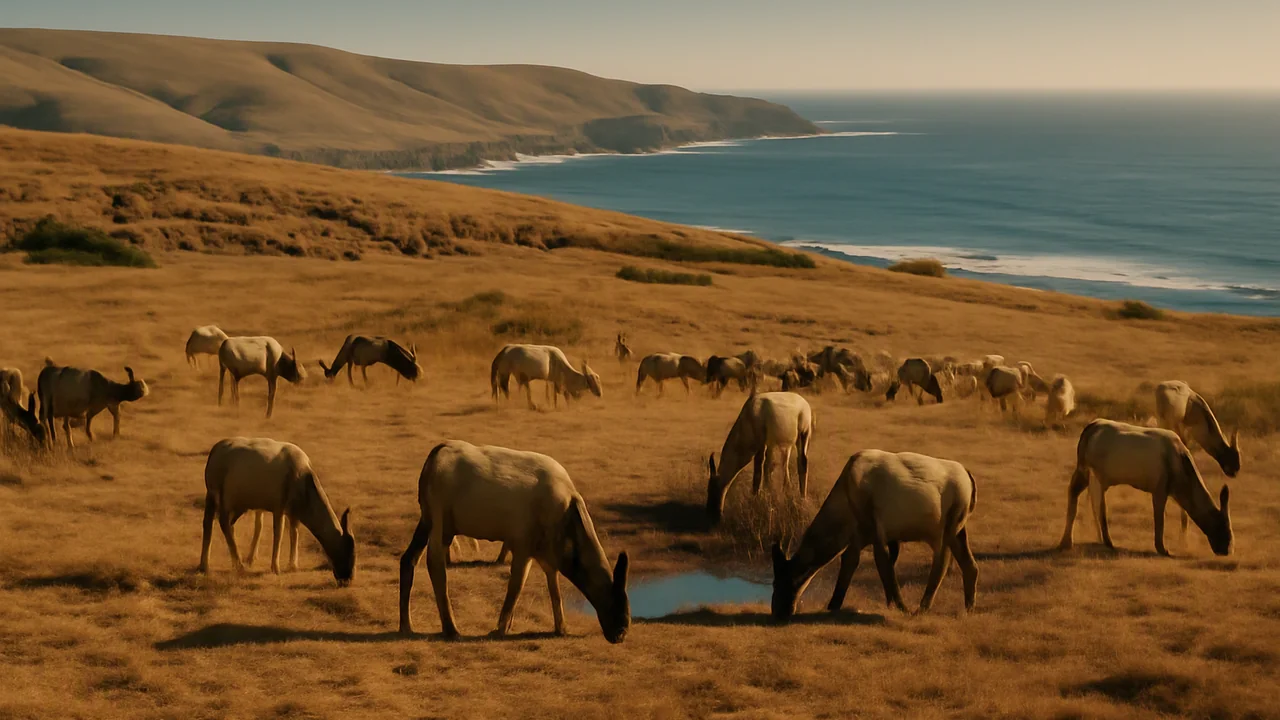
construct and defend a report, with mathematical models, that explains how carrying capacity, limiting factors and energy flow shaped the growth and decline of the peninsula elk herd, and present our plan to the board.
- I can analyze data to identify how living and nonliving factors depend on each other and affect the carrying capacity of an ecosystem.
- I can use evidence from mathematical or computational representations to support explanations and identify which factors have the largest effect on the carrying capacity for a given population.
- I can analyze a mathematical model to explain why not all energy is transferred to higher trophic levels, and how some is used for growth, maintenance, repair, or lost to the environment.
- I can analyze mathematical representations to identify the most important factors that determine biodiversity and population numbers in an ecosystem.
- I can use evidence from mathematical representations to support explanations about how living and nonliving factors affect biodiversity and population size, and how ecosystems interact at different scales.
- I can describe, using models, how factors affecting ecosystems at one scale can cause observable changes in ecosystems at a different scale.
Phase 5: Prove It
Warm-Up ~5 min
Do Now. The board has four minutes for your team. Write the one sentence you most want them to remember.
If the herd grew exponentially from 10 to 540 in 34 years, the per-capita rate r is about:
Instruction ~10 min
The question. Why did the peninsula elk herd grow from 10 animals to several hundred, level off, and then lose nearly half its members in a two-year drought, and how should the reserve plan for the next one? You are writing for the reserve’s advisory board: people who care about the elk and the land, but who want the mathematics explained.
What a strong report contains.
- A growth model. Use the herd’s history (sample data: 10 in year 0, about 540 by year 34, under 300 by year 36) to fit an exponential model to the growth phase and explain why the data cannot stay exponential. Sketch or fit a logistic curve and estimate a carrying capacity. Label every assumption.
- Limiting factors. Explain at least one density-dependent and one density-independent factor, and how drought changed the carrying capacity. Use your duckweed results as evidence that resources set K.
- Energy. Use an energy pyramid calculation to show how much producer energy supports the herd, and connect it to the seed-heat lab: why do elk need so much grass?
- Biodiversity. Explain how the herd’s grazing might affect plant diversity, using Simpson’s index and exclosures as the tools the board could use to find out.
- Your plan and a management question. Present your version 2 plan with its matrix and stress-test result, and propose one question the board should investigate, with the data that would answer it. Do not recommend anything the evidence does not support.
Worked example: one link. Claim: the drought lowered the carrying capacity of the peninsula. Evidence: the herd fell by nearly half while the area and the absence of hunting stayed the same; grass production fell by more than half (sample data); in the duckweed lab, cups with fewer nutrients leveled off at 80 fronds instead of 200. Reasoning: carrying capacity depends on resources; drought reduced forage and fresh water, so the same herd was suddenly far above the new K, and deaths exceeded births. Every section of your report needs this structure.
Sensitivity and accuracy. People disagree about how herds should be managed. Represent the facts accurately, label every number you did not measure as sample data or cite it, and keep your recommendation to what the evidence supports.
Presentation. In four minutes, live or recorded, present your model and plan, and answer one question about it.
Guided Exercises ~15 min
Rehearse and check your report with your team.
Independent Practice ~10 min
After the presentations, reflect.
What question did the board ask, and how well did your model answer it? What would you change in your report?
Name one idea from another team's plan that you would borrow, and explain the evidence behind it.
Project task: What Limits the Herd? The Herd Health Plan
Write a report of 900–1,300 words, with at least two data displays, for the reserve’s advisory board. Explain the growth, leveling-off and drought decline of the peninsula elk herd. Include a fitted growth model with a carrying-capacity estimate, at least one density-dependent and one density-independent factor, an energy pyramid calculation, a plan for monitoring plant diversity, your version 2 management plan with its decision matrix and stress-test result, and one management question with the data needed to answer it. Use evidence from the duckweed, seed-heat and sampling labs. Hand-drawn graphs are fully acceptable. Then present in four minutes, live or recorded.
Submission workflow
- Stage 1: Plan. Your draft growth graph with model, your energy calculation, and an outline linking each section to evidence.
- Stage 2: Peer-reviewed draft. A partner recomputes your growth rate and energy figures, checks every number has a source or is labeled sample data, and marks unsupported claims; submit their notes and your revision plan.
- Stage 3: Final report. 900–1,300 words with revised displays, calculations, decision matrix, citations and a limitations paragraph.
- Stage 4: Presentation and defense. Four minutes, live or recorded, answering one question about your model.
How it is scored
| Criterion | What proficient looks like |
|---|---|
| Growth model (HS-LS2-1) | Fits an exponential or logistic model correctly, estimates K, and explains the model’s assumptions and limits. |
| Limiting factors (HS-LS2-1) | Explains density-dependent and density-independent factors and how drought changed carrying capacity, with lab evidence. |
| Energy flow and matter cycling (HS-LS2-4) | The energy pyramid calculation is correct, connected to why herbivores need large areas of producers, and distinguishes energy flow from matter cycling. |
| Biodiversity and revision (HS-LS2-2) | Explains how grazing and drought could change plant diversity, how it could be measured, and how the plan was revised after the stress test. |
| Plan and management question | The plan follows from the decision matrix and test results; the question follows from the evidence and names the data that would answer it. |
| Evidence and communication | Every number sourced or labeled sample data; clear for a non-specialist; the presentation answers a question accurately. |
Closure ~5 min
You gave the reserve real, evidence-based advice. Next: the unit checkpoint.
Exit ticket: which Wonder Board question can you now answer best? Write the question and your answer.
How confident are you that you can use mathematical models and lab evidence to explain what limits a real population?
Teacher notes
Timing: the task spans about three periods (planning, peer review, presentations); this lesson is the presentation day, with drafting done in class and at home.
Setup: invite staff or family to role-play the advisory board, in person or by video. Visitors can score the communication row.
Listen for: reports that quote numbers without labels or sources; “the elk ate everything” with no role for rainfall; energy and matter treated as the same thing.
Support / stretch: give a section-by-section outline with sentence frames. Stretch: add a second growth model (Ricker or a stochastic drought year) and compare its fit.