3.03 Hunting the Dots: A Natural Selection Investigation
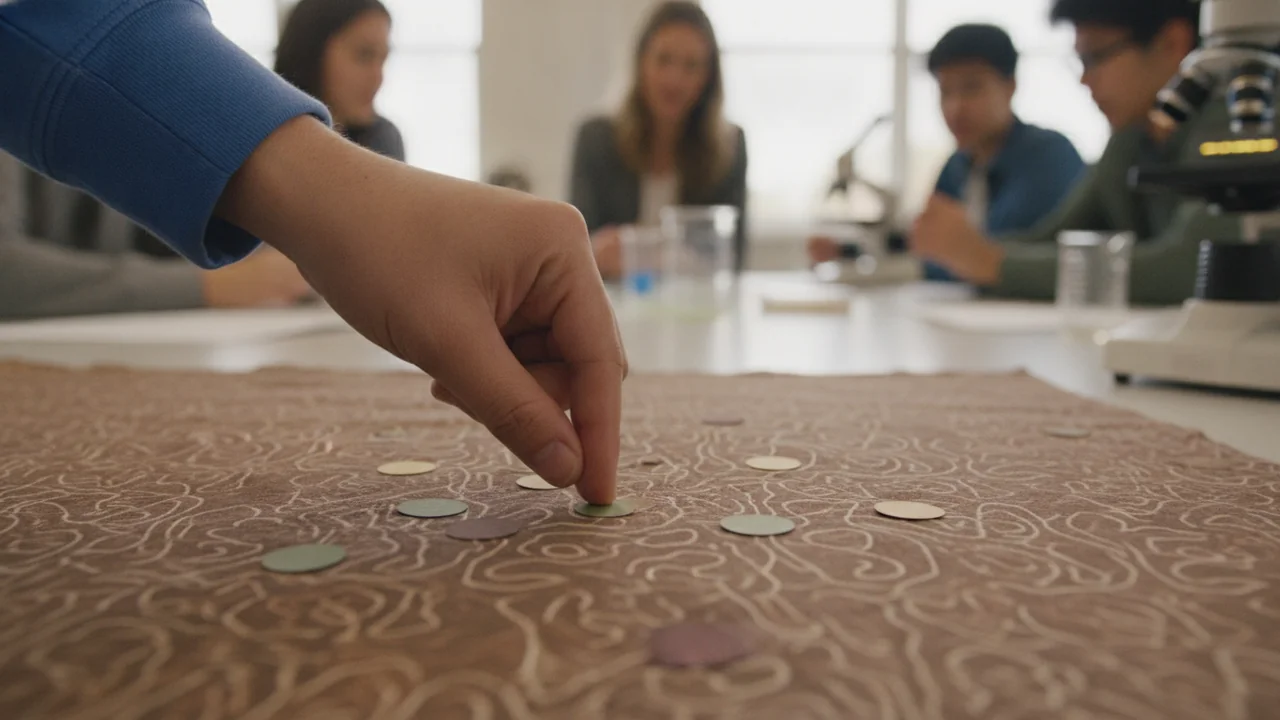
model predation on prey of two colors over several generations, organize and graph the proportion of each color, and use statistics to explain why the advantageous trait increases.
- I can organize data about genetic traits in a population over time using tables, graphs, or charts.
- I can use basic statistics and probability to analyze data and identify patterns in how traits change in a population over time.
- I can compare trait distributions across different time periods or populations using statistical and graphical methods.
- I can explain how evolution is mainly caused by four factors: the potential for a species to increase in number, heritable genetic variation due to mutation and sexual reproduction, competition for limited resources, and the proliferation of organisms that are better able to survive and reproduce.
Phase 2: Investigate
Warm-Up ~5 min
Do Now. A bird hunts insects on tree bark. Half the insects are bark-colored and half are bright green. Predict the colors of the insects left after a week, and after ten generations.
Predators remove 60% of green dots and 20% of brown dots on brown fabric each round, and survivors reproduce. After four generations, what proportion of the dots will be brown?
Instruction ~10 min
The four factors. HS-LS4-2 names four factors that together produce evolution by natural selection. (1) Populations have the potential to increase in number: most organisms produce more offspring than survive. (2) Individuals vary, and some of the variation is heritable, arising from mutation and sexual reproduction. (3) Resources are limited and there are dangers such as predators, so not all offspring survive to reproduce. (4) Individuals with heritable traits that help them survive and reproduce in their environment leave more offspring, so those traits become more common in the next generation. None of these steps requires an organism to “try” to change. Individuals do not evolve; populations do.
Measuring change with proportions. HS-LS4-3 asks you to use statistics to show that an advantageous trait increases in proportion. Proportions matter because a population’s size can rise and fall while the fraction with a trait steadily changes. Today’s model: 50 green dots and 50 brown dots (the prey) are scattered on brown patterned fabric (the habitat).
Lab procedure. (This lab spans two 50-minute periods.)
- Spread a 1 m square of brown patterned fabric on the table. A partner scatters 50 green and 50 brown paper dots across it while the predators look away.
- Each predator picks up as many dots as possible, one at a time, in 20 seconds. Count the dots removed of each color.
- Count the survivors. Reproduce: add dots of the same colors in proportion to the survivors until the population is back to 100.
- Record the generation, the number of each color and the proportion brown.
- Repeat for four generations. Then run a control: the same procedure on plain white paper, where neither color is camouflaged.
- Pool every group’s results and graph the mean proportion brown against generation for both habitats.
| Generation | Green at start | Brown at start | Green eaten | Brown eaten | Proportion brown at start | Control: proportion brown |
|---|---|---|---|---|---|---|
| 1 | 50 | 50 | 0.50 | 0.50 | ||
| 2 | ||||||
| 3 | ||||||
| 4 |
Worked example 1: an illustrative run. Suppose predators remove 60% of the green dots and 20% of the brown dots each round. Generation 1: 50 green, 50 brown, proportion brown 0.50. Survivors: 20 green, 40 brown, 60 in all. Scaling back to 100: 33 green and 67 brown, proportion brown 0.67. Repeating: generation 3 has 20 green and 80 brown (0.80), and generation 4 has 11 green and 89 brown (0.89). The brown trait did not appear because it was needed; it was already present, and it was passed on more often because brown dots were harder to see.
Is the change more than chance? Any single round could favor one color by luck. Two habits protect against being fooled. First, pool many groups’ results: if every group sees brown increase, chance is an unlikely explanation. Second, compare with the control habitat, where you expect proportions to wander around 0.5 with no steady trend. A steady trend in the camouflaged habitat and no trend in the control is strong evidence of selection.
Worked example 2: a chi-square check. If color made no difference, generation 4 should still be about 50 : 50. The illustrative run has 89 brown and 11 green. χ2 = (89 − 50)2/50 + (11 − 50)2/50 = 1,521/50 + 1,521/50 = 60.8, far above the critical value of 3.84 (1 degree of freedom, 0.05 level). Chance alone is a very poor explanation.
A small advantage adds up. In a simple model where carriers of a trait leave 25% more surviving offspring than non-carriers, a trait starting at 10% of a population rises to about 51% in 10 generations: 0.10, 0.12, 0.15, 0.18, 0.21, 0.25, 0.30, 0.35, 0.40, 0.45, 0.51. Over the thousands of generations in the history of a population like the ring salamanders, small advantages can produce large differences.
Guided Exercises ~15 min
Use the illustrative run or your own pooled data. Show your arithmetic.
Independent Practice ~10 min
Lab analysis (in your Evolution Notebook).
Write a claim-evidence-reasoning conclusion: did selection change the population? Use the pooled proportions, your graph and a chi-square value, and explain each of the four factors in the dot model.
Name two ways the dot model is unlike real salamanders (for example, how offspring are produced) and how each would change the result.
Closure ~5 min
A trait that helps survival rose in proportion, and statistics showed it was not luck. Next: how do we know different species share ancestors?
Exit ticket: explain why the brown dots increased without any dot “trying” to change. Use the words variation, heritable and proportion.
How confident are you that you can use proportions from a selection model to show that an advantageous trait increases?
Teacher notes
Timing: this lab spans two 50-minute periods: day 1 runs the fabric generations; day 2 runs the control, pools class data and writes the analysis.
Materials: 1 m squares of brown patterned fabric, white paper sheets for the control, hole punches and green and brown paper (or confetti), forceps, timers, cups for survivors, calculators, a class spreadsheet.
Data note: the 60% and 20% removal rates and the 25% advantage series are illustrative; class data will vary.
Listen for: “the green dots turned brown”; confusing number with proportion; treating one group’s result as proof.
Support / stretch: give a spreadsheet with the scaling formula built. Stretch: add a third color that matches the fabric only partly, and predict its trajectory.