2.04 The Estuary Smelt Debate: Causes, Criteria and Constraints
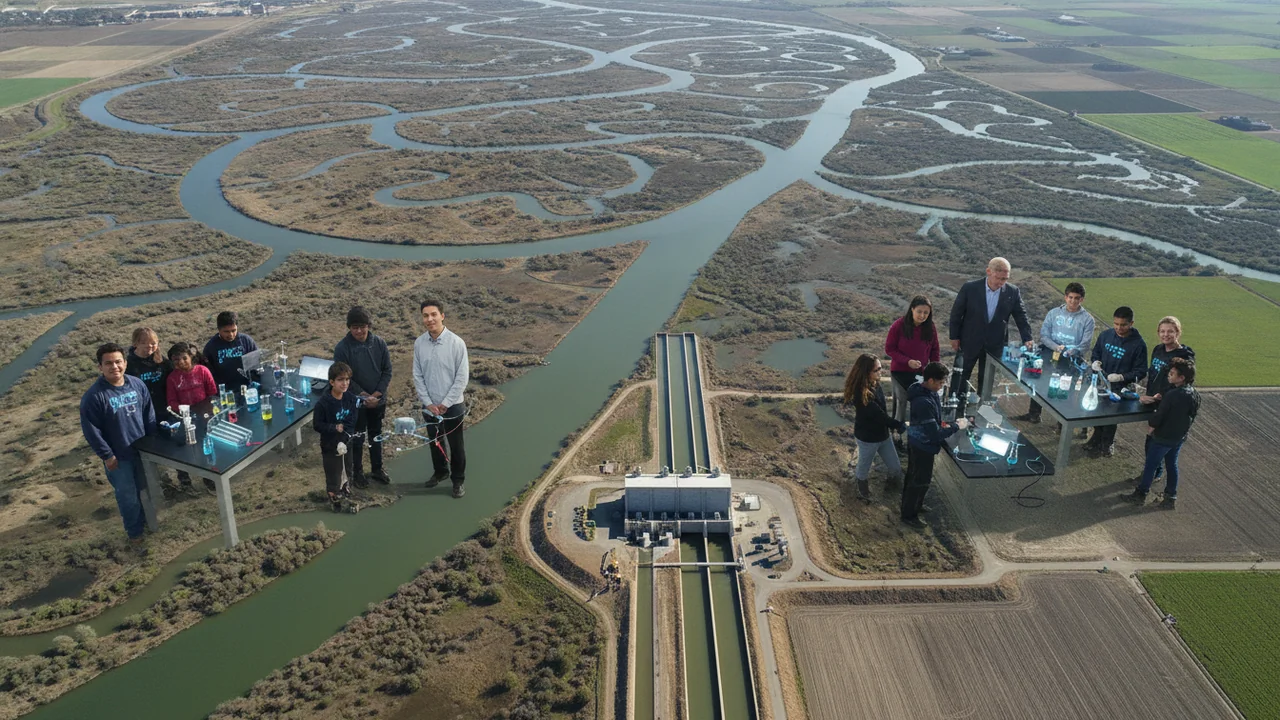
evaluate competing explanations for the decline of an estuary fish using evidence, and turn the strongest explanations into criteria and constraints for a solution.
- I can describe the strengths and weaknesses of a claim about how biodiversity responds to changing conditions, using my understanding of factors that affect biodiversity and relationships between species and their environment.
- I can describe and quantify the criteria for my solution, such as how much impact is reduced and which human activities are mitigated.
- I can identify and explain the constraints for my solution, including cost, human needs, and environmental impacts.
- I can analyze the tradeoffs involved in my solution.
Phase 2: Investigate
Warm-Up ~5 min
Do Now. A small, nearly transparent fish that lives about one year and is found only in one river estuary has declined so far that surveys that once caught hundreds now often catch very few. List every cause you can think of, then star the one you suspect most.
Engineers remove ONE cause of the fish's decline. What is most likely?
Instruction ~10 min
The estuary. In many regions, the place where two large rivers meet before flowing into a bay is the heart of the water system. Water pumped from the estuary flows through canals to distant farms and cities, serving millions of people. The estuary is also home to fish found nowhere else, such as a small smelt that lives about one year. When a species is endemic to one estuary and short-lived, a few bad years in a row can push it toward extinction.
Competing explanations. Scientists agree such fish have declined; they argue about how much each cause contributes. Evidence from estuaries like this supports several factors acting together:
- Water exports. Pumps change the direction of flow in channels and can draw fish toward them, where many are lost. Reduced outflow also moves the zone where fresh and salt water mix, which the smelt use as habitat.
- Invasive species. A non-native clam that arrived in ballast water filters enormous amounts of plankton, removing food that smelt and their prey need. Invasive water plants clog shallow channels and shelter non-native predators.
- Habitat loss. Most of the estuary’s original tidal marshes were drained and leveed for farms, removing shallow, food-rich habitat.
- Temperature and water quality. Smelt do poorly in warm water, and warmer summers shrink the area and season they can use. Contaminants from farms and cities add stress.
Worked example 1: evaluating a claim. Suppose someone claims: the pumps are the only reason the smelt declined. Evidence for: fish are lost at the pumps, and declines have been linked to periods of high exports. Evidence against (sample pattern): plankton dropped sharply after the invasive clam arrived, and the smelt kept declining in some periods with lower exports. A careful argument concludes that exports matter but cannot be the whole explanation. Notice the move: we did not ask who is to blame. We asked what the evidence shows about each cause. Judging the strengths and weaknesses of a claim like this is HS-LS2-6.
Degree of change matters. A modest change, such as one dry year, lowers survival a little, and the population can rebound. An extreme or repeated change, such as years of low outflow on top of lost food and habitat, can disrupt the resources the fish depends on so much that the estuary becomes a different ecosystem, dominated by invasive clams and warm-water species.
Worked example 2: from causes to criteria (HS-ETS1-1). Engineers turn a problem into criteria, what a solution must achieve, and constraints, the limits it must work within. Criteria might include: increase juvenile smelt survival; restore shallow, food-rich habitat (for example, 500 acres of tidal marsh); show measurable results within ten years. Constraints might include: maintain water supply for people and farms; stay within a budget; keep levees that protect homes; respect the rights and knowledge of local communities and Indigenous nations. Criteria can conflict, so engineers prioritize them, and the priorities are a societal choice informed by science.
Guided Exercises ~15 min
Build an evidence table for four claims, then define the problem.
| Claim: the main cause is… | Evidence for | Evidence against | Strength (1–3) |
|---|---|---|---|
| Water exports | |||
| Invasive clam and plants | |||
| Marsh habitat loss | |||
| Warm water and pollution |
Independent Practice ~10 min
Argument and problem statement.
Write an argument with a rebuttal: which two causes does the evidence support most strongly, and why is “the pumps are the only cause” a weak claim? Judge one strength and one weakness of that claim.
Write a problem statement for one estuary sub-problem (for example, food supply for young smelt). List three prioritized criteria, with numbers where possible, and three constraints, and explain which evidence led you to each.
Closure ~5 min
We turned a debate into a defined problem. Next: testing solutions with simulations and prototypes.
Exit ticket: explain how your solution would need to change if one of your constraints, such as water supply for farms, were removed.
How confident are you that you can evaluate evidence for several causes of a decline and turn them into criteria and constraints?
Teacher notes
Timing: this argumentation lab spans two 50-minute periods: day one for the evidence table and argument, day two for the problem statement.
Generic case: the estuary and its smelt are a composite of well-studied river estuaries; the “evidence against” pattern is described qualitatively as a sample pattern. Do not add real survey numbers unless you cite them.
Listen for: blaming one group (farmers, cities, fishers); treating criteria and constraints as the same; claims based only on timing.
Support / stretch: provide evidence cards to sort into the table. Stretch: rank the criteria two ways, as a fisher and as a farmer would, and explain the difference.