1.01 The Herd on the Peninsula: Growth, Limits and a Crash
The Herd Health Plan
What sets the limit on a population, and how should a reserve plan for a herd whose limit can change?
The mystery: Ten elk released onto a fenced coastal peninsula grew to several hundred over about three decades, then nearly half the herd died during a two-year drought.
describe exponential and logistic population growth, distinguish density-dependent from density-independent limiting factors, and ask testable questions about what limits the peninsula elk herd.
- I can identify and describe trends, averages, and other components in graphs, charts, or data tables that show population changes in ecosystems at different scales.
- I can find and describe data about the numbers and types of organisms, as well as information about boundaries, resources, and climate, in mathematical or computational representations.
- I can identify explanations that describe how boundaries, resources, climate, and competition affect the carrying capacity of an ecosystem.
- I can explain that some factors have a larger effect on carrying capacity than others, and that these factors are interrelated.
- I can describe how the importance of a factor can change depending on the scale of the ecosystem, such as comparing a pond to an ocean.
Phase 1: Spark
Warm-Up ~5 min
Do Now. Study the herd table on the board. Ten elk were released onto a fenced coastal peninsula with plenty of grass and no hunting. Write what you notice about how fast the herd grew in each decade, and one thing you wonder about the last row.
| Year | Elk counted (sample data) | Note |
|---|---|---|
| Year 0 | 10 | Herd released onto the fenced peninsula |
| Year 10 | about 90 | Plenty of grass, no hunting |
| Year 20 | about 330 | Growth slowing |
| Year 34 | about 540 | Close to the highest count |
| Year 36 | under 300 | After a two-year drought |
A herd near its carrying capacity faces a two-year drought that halves the grass supply. What happens?
Instruction ~10 min
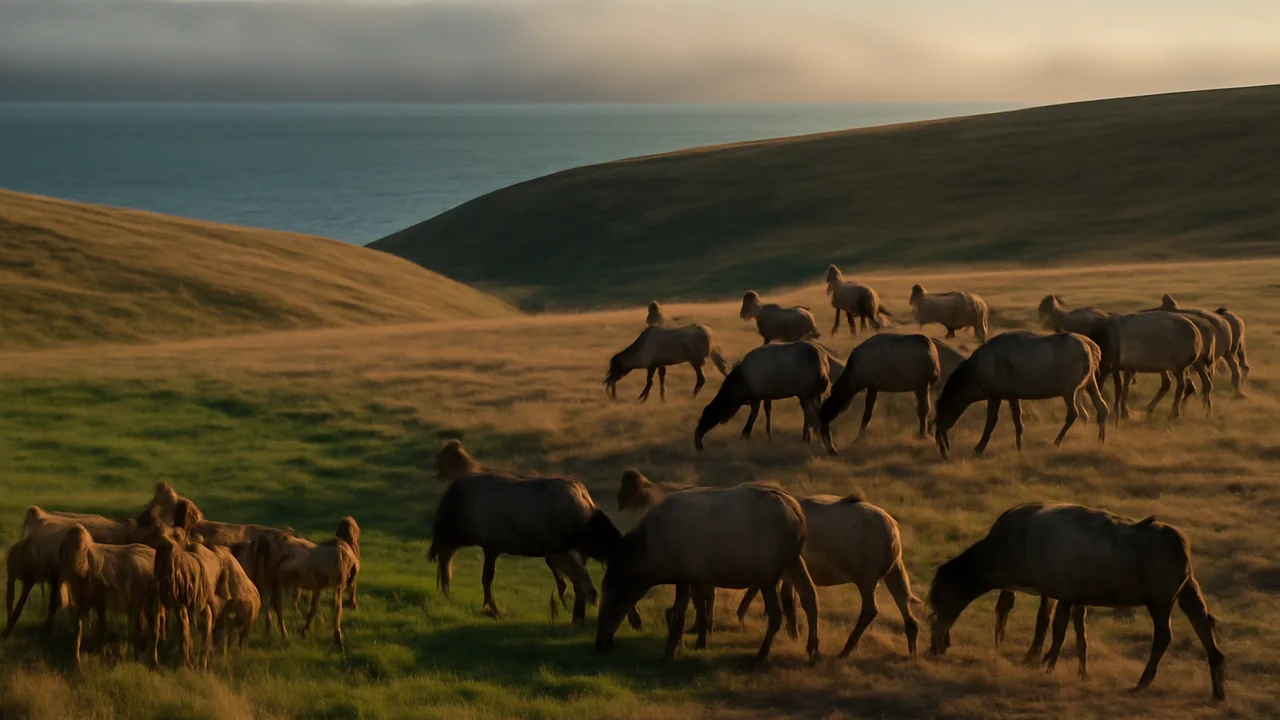
The phenomenon. Elk once grazed widely across many valleys and coastal hills, until market hunting and ranching cut some herds to tiny remnants. Reintroductions helped several herds recover. On one fenced coastal peninsula, a wildlife reserve released ten elk. With plenty of grass and no hunting, the herd grew for more than three decades, to roughly 540 animals (sample data, rounded). Then came a two-year drought, and the count fell to under 300: a loss of nearly half. Our question for the unit: what sets the size of a population, and why did this one crash?
Exponential growth. When resources are plentiful, each individual adds offspring at a roughly constant rate, and the population grows faster the bigger it gets. The model is N = N0ert, where r is the per-capita growth rate.
Worked example 1: fitting r. If the herd had grown exponentially from 10 to 540 in 34 years, then r = ln(540/10) ÷ 34 = ln 54 ÷ 34 ≈ 3.99 ÷ 34 ≈ 0.117 per year. The doubling time is ln 2 ÷ 0.117 ≈ 5.9 years. Kept up for another 34 years, the herd would pass 29,000 animals on a small peninsula. No population can keep that up for long.
Logistic growth and carrying capacity. As a population grows, each individual gets less food, water and space. Growth slows and levels off near the carrying capacity, K, the largest population the environment can support over time. The logistic model captures this: the growth rate is rN(1 − N/K). The graph is an S-shaped curve.
Worked example 2: where growth is fastest. With r = 0.4 and K = 500, a population of 100 grows by 0.4 × 100 × (1 − 0.2) = 32 a year; at 250 it grows by 0.4 × 250 × 0.5 = 50, the fastest; at 450 it grows by only 0.4 × 450 × 0.1 = 18. Growth is fastest at half of K.
What limits a population? Density-dependent factors get stronger as the population gets denser: competition for grass, the spread of disease, parasites. Density-independent factors affect a population whatever its size: a drought, a fire, a hard freeze. The two interact. A drought lowers the grass supply, which lowers the carrying capacity; a herd that fit comfortably at its old K is suddenly far above the new one. On a fenced peninsula, the fence also matters: the elk cannot move to find water and forage elsewhere.
Scale matters. HS-LS2-1 asks about carrying capacity at different scales: a cup of pond plants, a fenced peninsula, a whole region. The same mathematics applies, but the most important limiting factors differ. A cup is limited by its water surface; a region by rainfall and habitat.
Asking questions. Why did the elk die? is a start. Is the number of elk in a year related to the rainfall in the previous winter? is testable with herd counts and weather records.
Reading: OpenStax Biology 2e, Chapter 45 (Population and Community Ecology) and Chapter 46 (Ecosystems), CC BY 4.0.
Guided Exercises ~15 min
Work with a partner. Show the arithmetic for every calculation.
Independent Practice ~10 min
Start your Herd Notebook.
Sketch the growth curve you think the herd followed from year 0 to year 36. Label the exponential phase, the approach to carrying capacity and the drought. Then write two testable questions your sketch raises.
Name one density-dependent and one density-independent factor that could have limited the herd, and explain how the two could interact during the drought.
Closure ~5 min
We have a phenomenon and our first models. Next lesson, we meet the client and form our project teams.
Exit ticket: in two sentences, explain why the herd could not keep growing exponentially, using the words carrying capacity and resources.
How confident are you that you can describe exponential and logistic growth and explain how limiting factors set a carrying capacity?
Teacher notes
Materials: the herd table (projected), graph paper, calculators with ln, chart paper for the Wonder Board.
Data note: the herd numbers are rounded sample data shaped like a real reintroduction record; present them as sample data.
Listen for: “K is a fixed number”; confusing “more added per year” with “a higher per-capita rate”; and treating drought as density-dependent.
Support / stretch: give a growth-curve template with the three phases outlined. Stretch: plot ln N against time for the first 20 years; a straight line means exponential growth, and its slope estimates r.