3.10 Unit 3 Checkpoint: Evidence, Selection, Adaptation and New Species
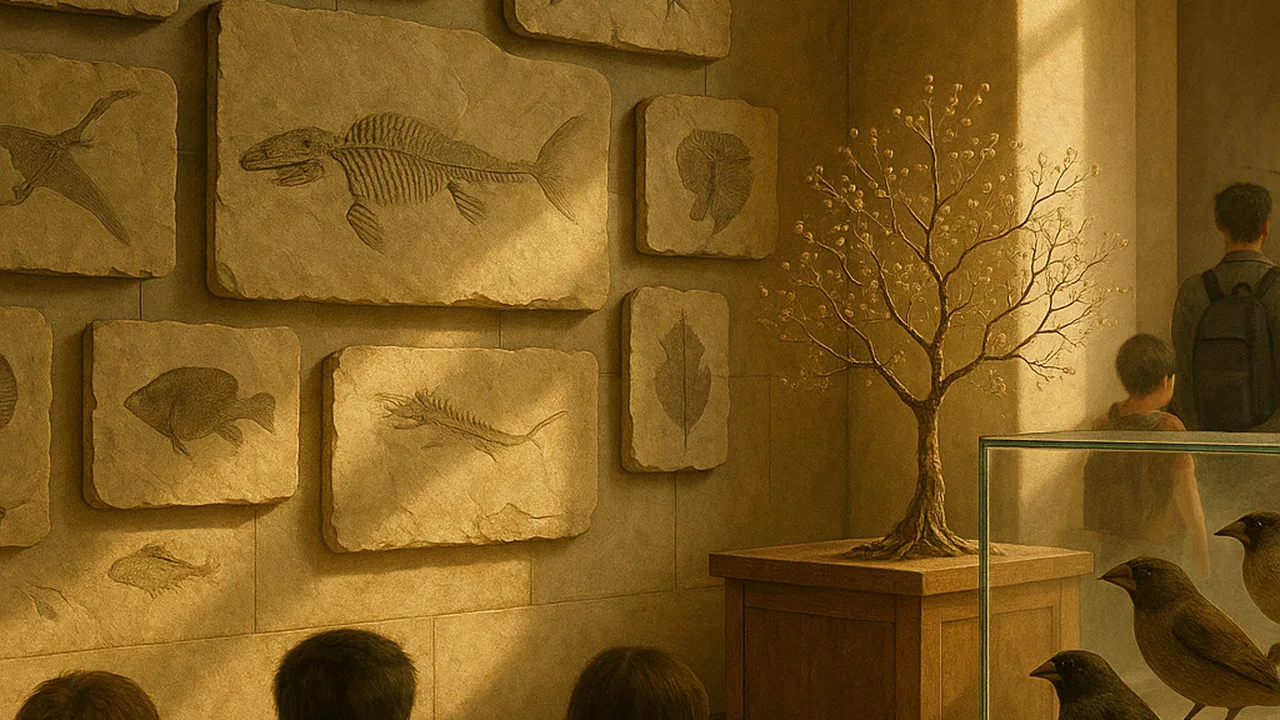
show what I learned about common ancestry, natural selection, adaptation and how environmental change affects species, using data questions and constructed responses.
- I can describe the difference between natural selection as a process and biological evolution as a result of that process.
- I can explain the cause and effect relationship between genetic variation, the selection of advantageous traits, and the evolution of populations that express those traits.
- I can use basic statistics and probability to analyze data and identify patterns in how traits change in a population over time.
- I can compare trait distributions across different time periods or populations using statistical and graphical methods.
- I can evaluate how well the given evidence supports logical arguments that link environmental changes to changes in the number of individuals or species, based on factors that affect survival and reproduction.
Phase 5: Prove It
Warm-Up ~5 min
Do Now. Back to our phenomenon: salamanders around a dry valley differ gradually, and the two ends rarely interbreed. In two sentences, explain the ring using selection and isolation.
Individual organisms evolve during their lifetimes.
Instruction ~10 min
Biologists, this is the unit checkpoint. Part A is multiple choice with data and a scenario set where several questions share one situation. Part B is short constructed responses, each scored 0 to 3. Read each question twice and show your work.
How a 0–3 answer is scored. 3: a correct claim, accurate evidence or calculation, and reasoning that links them with a science idea. 2: a correct claim with evidence but weak or missing reasoning. 1: a partly correct claim or evidence only. 0: incorrect or blank.
Worked example: from 1 to 3. Question: “Why did more bacteria become resistant?” “Because of the antibiotic” earns 1. Diego wrote: “The antibiotic killed susceptible bacteria but not the few resistant ones already present (claim + idea). The resistant fraction rose from 1% to about 9% after one round (evidence). Because resistance is heritable, survivors passed it on, so each round raised its frequency (reasoning).” That earns 3.
Data for questions 1–3 (sample data). Number of amino-acid differences from humans in the same 100-amino-acid stretch of a protein: chimpanzee 0; rhesus monkey 1; dog 9; chicken 13; tuna 21.
Scenario set for questions 7–10 (sample data). A beetle species has a pale form and a dark form; color is inherited. In Wood X, soot from a nearby factory darkened the tree bark. Wood Y, far away, kept pale bark. Birds hunt beetles on the bark in both woods.
| Generation | Wood X (bark darkened): proportion dark beetles | Wood Y (pale bark): proportion dark beetles |
|---|---|---|
| 0 | 0.10 | 0.10 |
| 5 | 0.18 | 0.09 |
| 10 | 0.31 | 0.11 |
| 15 | 0.47 | 0.10 |
| 20 | 0.62 | 0.08 |
Claim for questions 11–12. After a dam turned a stretch of river into a lake, a river minnow that needs fast water declined from many thousands to a few hundred in ten years, while a lake sunfish increased. A report claims the dam caused the minnow’s decline.
Guided Exercises ~15 min
Part A: answer on your own. Your teacher reviews answers after everyone finishes.
Independent Practice ~10 min
Part B: constructed responses, each scored 0–3.
14. Use the beetle table. Organize the Wood X data in a graph, describe what each wood's data show about the distribution of color over time, and use a statistic (a proportion change, a mean or a chi-square against the Wood Y value) to argue that selection, not chance, changed Wood X. (0–3)
15. Apply all four factors of natural selection to the beetles in Wood X. Explain the difference between natural selection (the process) and evolution (the result), and name one valid, reliable source of evidence you would want. (0–3)
16. Explain how a biotic factor and an abiotic factor in Wood X together changed the frequency of the dark-color allele, and how this made the population better adapted to its environment. (0–3)
17. Communicate the evidence for common ancestry in two formats: (a) sketch a tree from the protein data in questions 1–3, and (b) write three sentences explaining how DNA or protein data and the fossil record, at different scales, support the same tree. Name your sources. (0–3)
18. Evaluate the claim that the dam caused the minnow's decline. Identify the evidence given, judge its strengths and weaknesses, say whether it shows cause or correlation, and describe additional evidence that would settle it. Then name one way environmental change can lead to a NEW species, using the salamander ring. (0–3)
Closure ~5 min
Unit 3 complete. Next unit: how behavior shapes survival, and what a near-extinction leaves behind in a population’s genes.
Exit ticket: which idea from this unit are you most confident about, and which do you want to review?
How confident are you that you can explain common ancestry, natural selection and adaptation with evidence and data?
Teacher notes
Answer key, Part A: 1 D; 2 A; 3 A; 4 B; 5 D; 6 98 and 17 (20 ÷ 118 ≈ 0.17); 7 B (52); 8 A; 9 B; 10 B; 11 B; 12 A; 13 True.
Coverage: HS-LS4-1: questions 1–4 and 17 (two formats, sources, scales). HS-LS4-2: 5, 6, 9, 15 (four factors, process versus result, sources). HS-LS4-3: 7, 8, 13, 14 (organize, describe, statistics, trait distribution). HS-LS4-4: 9, 10, 16, and 15’s source (adaptation, biotic and abiotic factors, gene frequency). HS-LS4-5: 11, 12 and 18 (claims, evidence, additional evidence, cause versus correlation, emergence).
Scoring Part B (0–3): 3 = claim + accurate data or calculation + reasoning with a science idea; 2 = claim + evidence, weak reasoning; 1 = partial; 0 = incorrect or blank. Question 14 model: Wood X rises 0.10 to 0.62 while Wood Y stays near 0.10; with 100 beetles sampled at generation 20, 62 dark versus an expected 10 gives χ2 = 522/10 + 522/90 ≈ 270.4 + 30.0 ≈ 300, far above 3.84.
Support: allow a formula card (proportion; χ2 = Σ(O − E)2/E; percent identity) and read-aloud for any student whose plan allows it.