2.03 Salt and Survival: Brine Shrimp Hatching Across Salinities
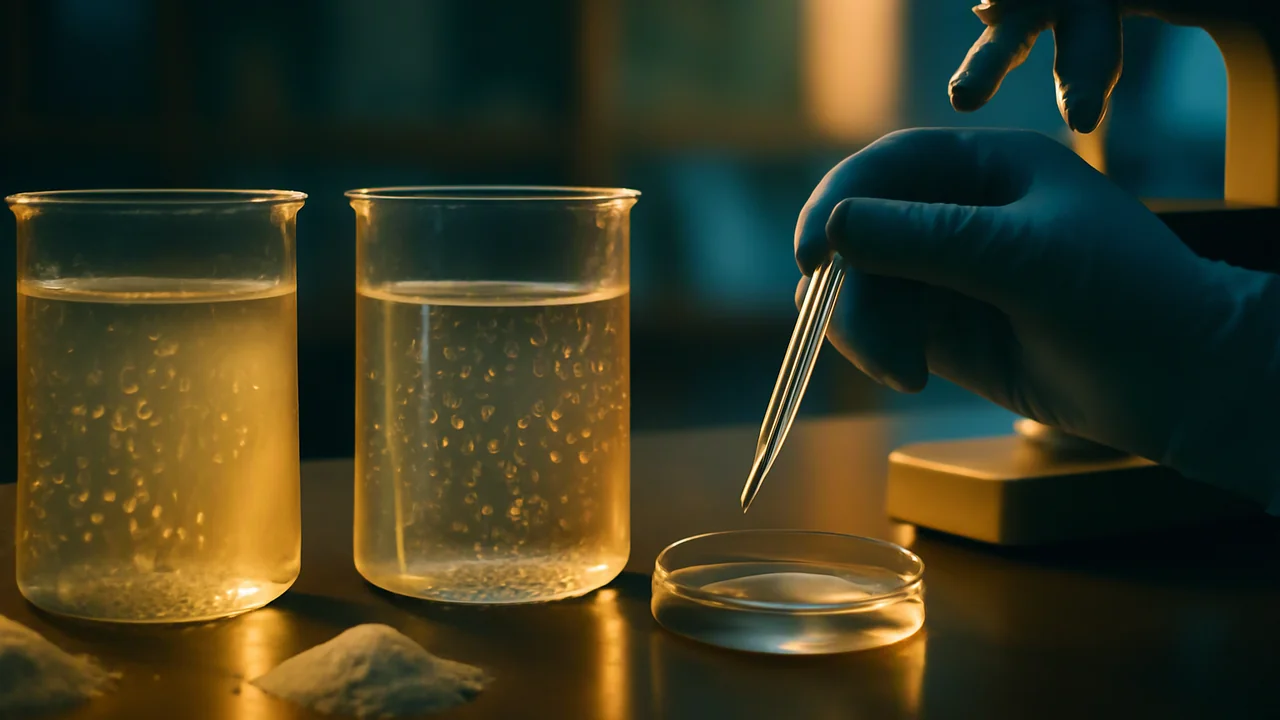
measure brine shrimp hatching success across a range of salinities, identify the range of tolerance, and use the results to explain how changing salinity affects populations and ecosystems.
- I can describe additional evidence about factors that affect biodiversity in an ecosystem.
- I can describe additional evidence about how species interact with each other and with their physical environment.
- I can describe additional evidence about how the numbers of species and organisms change after modest or extreme changes in ecosystem conditions.
- I can use additional evidence to assess how valid and reliable the given evidence is for supporting the argument that ecosystem resiliency depends on the degree of change in the environment.
Phase 2: Investigate
Warm-Up ~5 min
Do Now. Seawater is about 35 grams of salt per liter. Some salt lakes are several times saltier; a river is nearly fresh. Predict how a small crustacean that lives in salty water would do in each.
Brine shrimp cysts are placed in water of 0, 35 and 80 ppt salt. Where will the most hatch?
Instruction ~10 min
Every organism has a range of tolerance. For any environmental factor, such as temperature, salinity or pH, a species survives and reproduces well within an optimal range, poorly in the zones of stress on either side, and not at all beyond its limits. When conditions shift, the populations of some species grow, others shrink, and the ecosystem can change.
Salinity is changing in many waters. Salinity is measured in parts per thousand (ppt), grams of salt per liter. Seawater is about 35 ppt. Three kinds of water body show why it matters:
- A terminal salt lake has no outlet, so it is much saltier than the ocean. Its brine shrimp feed huge numbers of migrating birds. When the streams that feed such a lake are diverted for cities, the lake shrinks and its salinity rises.
- An inland saline lake fed mostly by farm runoff gets saltier as inflows shrink and water evaporates, and fish die-offs can follow.
- A river estuary is where fresh river water meets salty ocean water. In droughts, when river flows drop, salt water pushes farther inland, changing conditions for fish and for the farms and cities that draw water there.
The organism. Brine shrimp (Artemia) are tiny crustaceans whose eggs, called cysts, can survive drying for years and hatch within a day or two in salt water. They are sold as fish food and are safe and inexpensive. Hatching success, the percentage of cysts that hatch, is a simple, countable measure.
Lab procedure.
- Make 200 mL of each salt solution from non-iodized salt: 0, 10, 20, 35, 50 and 80 ppt (for example, 7 g of salt in 200 mL is 35 ppt). Label each cup and record its temperature.
- Add a small, equal pinch of cysts (about 50 to 100) to each cup. Place all cups under the same lamp at the same distance.
- After 24 hours, gently swirl each cup and look for swimming nauplii (larvae). Record observations.
- After 48 hours, take three drops from each cup, count hatched nauplii and unhatched cysts under a hand lens or microscope, and calculate the percentage hatched.
- Average the three counts for each salinity and add your results to the class table.
- Graph percentage hatched against salinity and mark the optimal range and the zones of stress.
| Salinity (ppt) | Hatched | Unhatched | % hatched (mean of 3 drops) | Observations |
|---|---|---|---|---|
| 0 | ||||
| 10 | ||||
| 20 | ||||
| 35 | ||||
| 50 | ||||
| 80 |
Worked example 1: making a solution. 35 ppt means 35 g per liter. For 200 mL (0.2 L) you need 35 × 0.2 = 7 g; for 500 mL, 17.5 g.
Worked example 2: reading an illustrative result. A class counted 50 cysts per salinity after 48 hours: 2 hatched in 0 ppt (4%), 21 in 10 ppt (42%), 34 in 20 ppt (68%), 41 in 35 ppt (82%), 30 in 50 ppt (60%) and 9 in 80 ppt (18%). The curve rises, peaks near seawater salinity, and falls on both sides. A lake moving from 35 ppt toward 80 ppt would still support some brine shrimp, but far fewer, with effects on every bird that feeds on them.
How good is the evidence? HS-LS2-6 asks you to judge evidence. One class’s hatching data are valid for hatching (they measure what they claim to) but say nothing yet about adult survival or reproduction. They are more reliable if other classes, with other cysts, get the same curve.
No cysts? Use the illustrative class data to build the curve and complete the analysis.
Reading: OpenStax Biology 2e, Sections 44.4 (Aquatic Biomes) and 45.6–45.7 (Community Ecology) and Chapter 47 (Conservation Biology and Biodiversity), CC BY 4.0.
Guided Exercises ~15 min
Use your class data or the illustrative set.
Independent Practice ~10 min
Lab analysis.
Describe the shape of your tolerance curve and identify the optimal range, citing at least three data points. Then choose one of the three water bodies and predict how a change in salinity there would affect a population with a similar curve, and which other organisms in its food web would feel the effect.
Identify the controlled variables and one you could not fully control. Then judge how valid and reliable your class's evidence is for the claim that a large salinity change would reduce this population, and suggest a second measurement.
Closure ~5 min
A tolerance curve is evidence about how a changing condition shifts a population. Next: weighing competing explanations for a declining fish.
Exit ticket: using your curve, explain what would happen to a salt lake's birds if diversions raised its salinity far above the shrimp's optimal range.
How confident are you that you can measure a tolerance curve and use it to explain how changing conditions affect populations?
Teacher notes
Timing: set-up fills one 50-minute period; counts after 48 hours take about 15 minutes; the analysis is a second 50-minute period. Teach 2.04 between set-up and counts.
Materials: brine shrimp cysts (aquarium store, about 1/4 teaspoon per class), non-iodized salt, a balance, dechlorinated water, six labeled cups or dishes per group, a lamp, thermometers, droppers, hand lenses or a low-power microscope, goggles.
Listen for: “salt water kills everything” (a tolerance curve has an optimum); confusing valid with reliable.
Support / stretch: give a ppt calculation card. Stretch: test 5 ppt steps around the peak to locate the optimum more precisely.