3.04 Fixed Soda, More and More Vinegar: The Limiting-Reactant Series
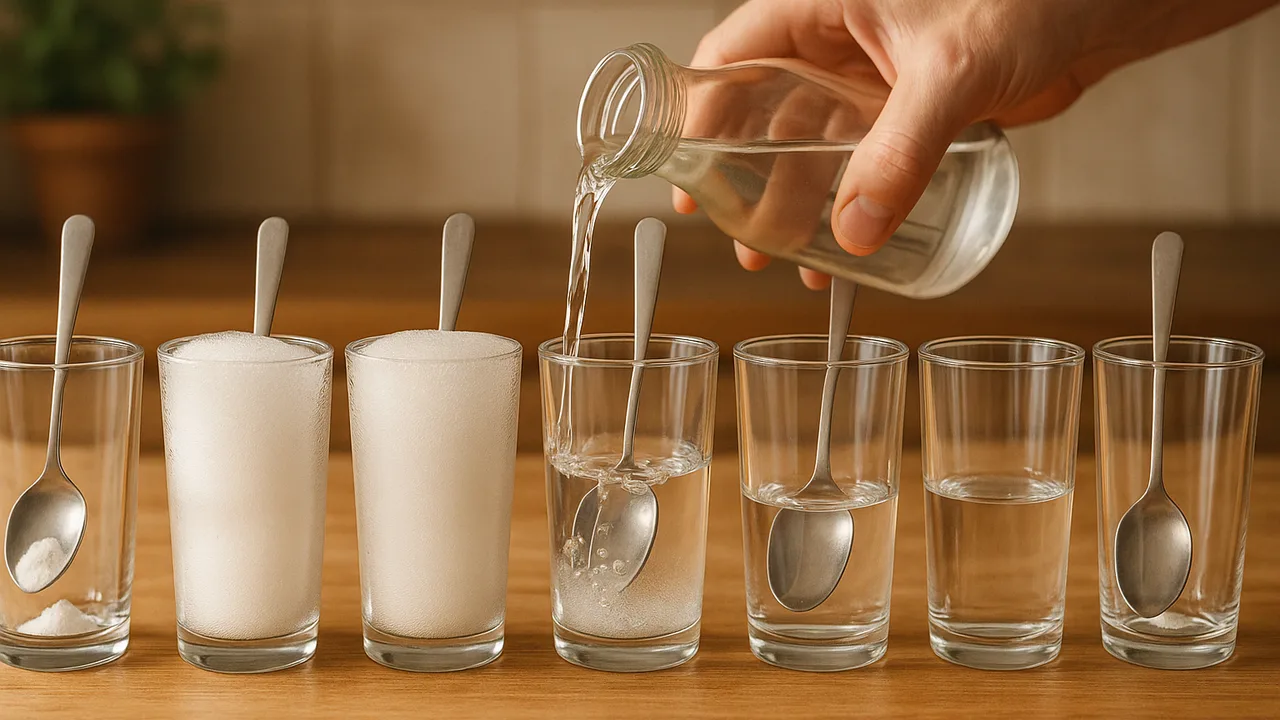
run a series of reactions with a fixed mass of baking soda and increasing volumes of vinegar, graph the carbon dioxide made, and use the graph and a particle model to explain which reactant runs out and what is left over.
- I can use calculations, graphs, or diagrams to show quantitative information about chemical reactions.
- I can predict the relative number of atoms in the reactants and products of a chemical reaction using mathematical representations.
- I can calculate the mass of any substance in a chemical reaction if I know the mass of another substance involved.
Phase 2: Investigate
Warm-Up ~5 min
Do Now. A sandwich needs 2 slices of bread and 1 slice of cheese. You have 10 slices of bread and 4 slices of cheese. How many sandwiches can you make, and what is left over? Draw it.
Each flask gets 2.00 g of baking soda. Flasks get 5, 10, 20, 30, 40 and 50 mL of vinegar. How will the CO2 mass change as the vinegar increases?
Instruction ~10 min
The co-op’s question in the lab. A loaf rises only as much as its leavening reaction lets it. If the batter has more soda than acid, some soda is left over (soapy). If it has more acid than soda, the extra acid is left over (a sharper, sour taste) and no more gas is made. Today you find, by experiment, the point where the two run out together.
Limiting and excess. The reactant that runs out first is the limiting reactant; it sets how much product forms. The other is in excess; some of it is left over. In the sandwich warm-up, 4 slices of cheese make 4 sandwiches and use 8 slices of bread, so cheese is limiting and 2 slices of bread are left over. Molecules work the same way, with the balanced equation as the recipe.
Procedure (two periods). (1) Label eight 250 mL flasks with 5, 10, 15, 20, 25, 30, 40 and 50 mL. (2) Put that volume of vinegar in each, then add water to make 50 mL of liquid in every flask, so the amount of liquid that can hold dissolved gas is the same. (3) Weigh each flask with a paper holding 2.00 g of baking soda. (4) Add the soda, swirl for 3 minutes until fizzing stops, and weigh again. The mass loss is the CO2 made. (5) Leftover test: add 1 mL of vinegar to each spent flask. Fizzing means soda was left over. Then add a pinch of baking soda. Fizzing now means acid was left over. A few drops of red cabbage indicator give a second check: blue-green means leftover soda, pink means leftover acid.
| Vinegar (mL) | Mass before (g) | Mass after (g) | CO2 (g) | Fizz with vinegar? | Fizz with soda? |
|---|---|---|---|---|---|
| 5 | |||||
| 10 | |||||
| 15 | |||||
| 20 | |||||
| 25 | |||||
| 30 | |||||
| 40 | |||||
| 50 |
Worked example 1: reading the graph (sample class data). Class averages of CO2 mass: 5 mL 0.16 g; 10 mL 0.33 g; 15 mL 0.50 g; 20 mL 0.66 g; 25 mL 0.83 g; 30 mL 0.93 g; 40 mL 0.95 g; 50 mL 0.94 g. Plotted, the points climb in a straight line, then flatten. The rising part has a slope of about 0.83 ÷ 25 = 0.033 g of CO2 per mL of vinegar; there, the vinegar is limiting. The flat part sits at about 0.95 g; there, the 2.00 g of soda is limiting. The two lines cross where 0.033 × V = 0.95, so V ≈ 29 mL. Below about 29 mL, soda is left over; above it, acid is.
Checking with the leftover test (sample results). Flasks 5 through 25 mL fizzed again when vinegar was added and turned blue-green with indicator: leftover soda. Flasks 40 and 50 mL fizzed when soda was added and turned pink: leftover acid. The 30 mL flask fizzed only weakly with soda: just past the crossing point. Two independent kinds of evidence, the graph and the leftover test, agree.
Worked example 2: a particle model. The equation NaHCO3 + CH3COOH → NaCH3COO + H2O + CO2 has a 1 : 1 ratio. Draw 6 baking-soda units and 4 acetic acid molecules. Each acid molecule pairs with one soda unit, so 4 CO2 molecules form and 2 soda units are left over: acid limiting. Now draw 6 soda and 9 acid: 6 CO2 form and 3 acid molecules are left over: soda limiting. Count the atoms before and after in either drawing, leftovers included, and they match. Darius noticed: “The plateau is the soda’s fault, not the vinegar’s. You can’t make more CO2 than the soda has carbon for.”
Why this matters for 200 loaves. The co-op wants to sit exactly at, or just past, the crossing point: all the soda used, no soapy leftover, and no wasted acid. In 3.05 you will learn to calculate that point before doing a single experiment.
Guided Exercises ~15 min
Use your graph and the particle drawings.
Independent Practice ~10 min
Graph and explain, in your Leavening Notebook.
Plot your class's CO2 mass against vinegar volume. Draw the two best-fit lines, find where they cross, and write a paragraph naming the limiting reactant on each side of the crossing point, using both the graph and the leftover test as evidence.
Predict how the graph would change if every flask had 4.00 g of baking soda instead of 2.00 g. Sketch the new graph next to the old one and explain the new plateau height and crossing point.
Closure ~5 min
We found the crossing point by experiment. Next phase, we learn to count particles by weighing, so we can calculate it.
Exit ticket: the co-op's half-buttermilk batch had plenty of soda but too little acid. Which side of the crossing point was it on, and what two problems does that explain?
Teacher notes
Materials (per group): eight 250 mL flasks (or sturdy cups), white vinegar (5%, about 200 mL), baking soda (eight 2.00 g portions plus a little extra for the leftover test), a 50 mL graduated cylinder, a balance reading to 0.01 g, red cabbage indicator in a dropper bottle, goggles, aprons.
Setup: to save time, assign each group two or three volumes and pool the class data. The theoretical crossing point (3.05) is 28.6 mL for vinegar with 0.050 g acetic acid per mL; real vinegar strengths vary a little, so your class value may differ by a few mL.
Listen for: “more vinegar always means more gas”; “the limiting reactant is the one there is less of by mass” (it depends on the ratio, not the raw amounts).
Support / stretch: give a graph grid with axes labeled and the two lines started. Stretch: with 4.00 g of soda the plateau doubles to about 1.9 g and the crossing point moves to about 57 mL; explain why the rising slope does not change.