1.03 Spectroscope Lab: Line Fingerprints from Gas Tubes and LEDs
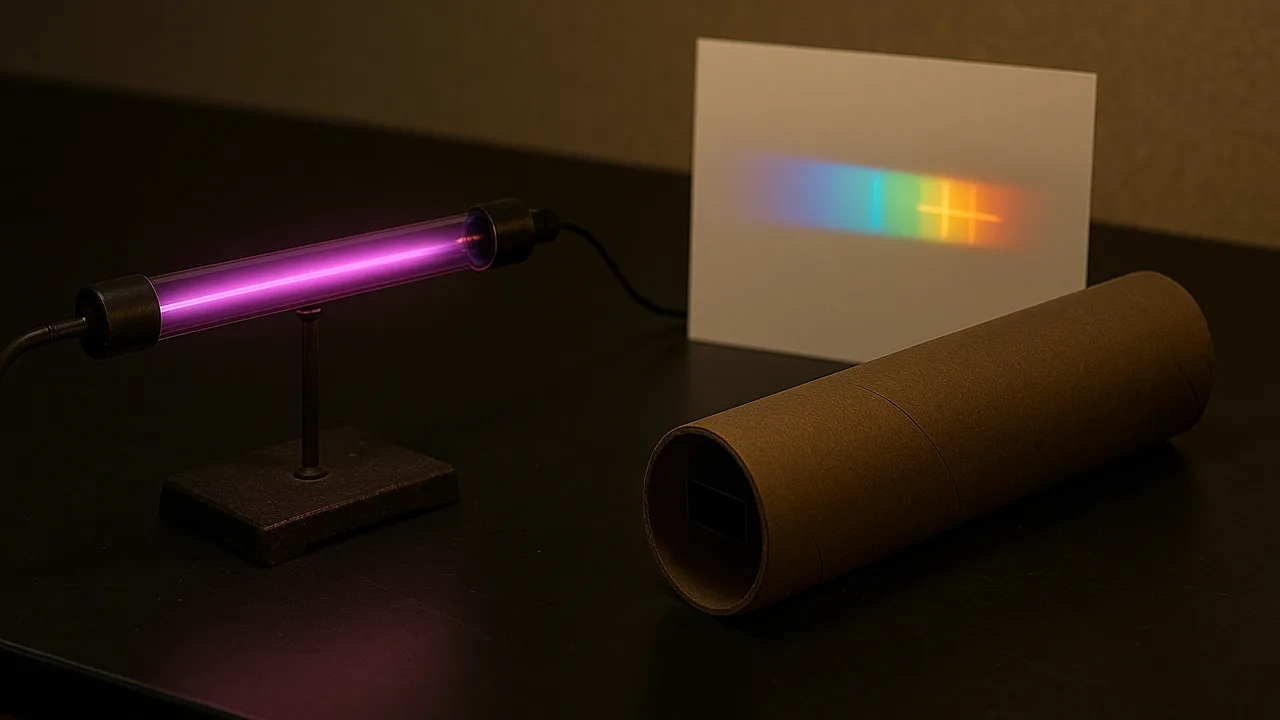
build and calibrate a paper spectroscope, record the spectra of gas-discharge tubes, LEDs and a white lamp, and use the line patterns to identify an unknown gas and argue that each element gives off only certain energies of light.
- I can identify and describe how elements are arranged in the periodic table.
- I can explain that atoms have a positively charged nucleus made of protons and neutrons, surrounded by negatively charged electrons.
- I can describe how the number of protons and the arrangement of electrons, especially the outermost electrons, are important for understanding elements.
Phase 2: Investigate
Warm-Up ~5 min
Do Now. Sunlight through a prism or a rain shower makes a rainbow. Sketch what you think you will see when you look at the glowing gas in a hydrogen tube through a spectroscope.
Through a spectroscope, the pink glow of a hydrogen tube will look like…
Instruction ~10 min
The investigation question. A flame test shows one blended color. A spectroscope spreads that light out by wavelength so you can see exactly which wavelengths are present. Today you build one, calibrate it, and record the spectra of glowing gases and of everyday lights. This lab runs two 50-minute periods.
Three kinds of spectra. A hot, dense solid such as a light-bulb filament gives a continuous spectrum, every color blended into a rainbow. A hot, thin gas, such as hydrogen in a discharge tube, gives an emission (line) spectrum: a few bright lines on a dark background. A cool gas in front of a continuous source gives an absorption spectrum: a rainbow with dark lines at exactly the wavelengths that gas would emit. Sunlight has such dark lines, including two at sodium’s 589 nm. In 1868, astronomers watching the Sun’s glowing outer gases during an eclipse found a bright yellow line near 587.6 nm that matched no known element; it was helium, found in the Sun decades before it was isolated on Earth.
How the spectroscope works. A narrow slit lets in a thin strip of light. A diffraction grating, a film ruled with about 1,000 lines per millimeter, bends each wavelength by a different angle, so the strip is spread into its colors beside a printed scale. Build: tape the grating over a hole at one end of a card tube or small box, cut a 1 mm slit at the other end, and tape a nanometer scale beside the slit.
Calibrating with a known source. Ordinary fluorescent lights contain mercury vapor, and NIST lists mercury’s bright visible lines at 404.7, 435.8, 546.1, 577.0 and 579.1 nm. Point your spectroscope at a classroom fluorescent lamp, find the strong green line, and slide your scale until it reads 546 nm. Now every reading is tied to a known wavelength.
Worked example 1: checking a reading. Grace read the red line of the hydrogen tube at 650 nm. NIST gives 656.3 nm. Percent error = |656.3 − 650| / 656.3 × 100 = 0.96%, about 1%. A paper scale read to the nearest 5 nm cannot do much better, so her spectroscope is working well. Hydrogen’s four visible lines (NIST) are 656.3 nm (red), 486.1 nm (cyan), 434.0 nm (blue-violet) and 410.2 nm (violet).
Procedure. (1) Build and calibrate your spectroscope. (2) Your teacher switches on one tube at a time: hydrogen, helium, neon and an unknown. Sketch each spectrum in colored pencil above the scale and record the wavelength of every bright line. (3) Look at a white incandescent or halogen bulb, a white LED, and red, green and blue LEDs. (4) Compare each line pattern with the NIST lines on the reference card and identify the unknown.
| Source | Type of spectrum | Lines or bands seen (nm) | Closest NIST lines (nm) | Notes |
|---|---|---|---|---|
| Hydrogen tube | ||||
| Helium tube | ||||
| Neon tube | ||||
| Unknown tube | ||||
| White bulb / white LED | ||||
| Red, green, blue LEDs |
Worked example 2: identifying the unknown (sample data). Tomas’s team saw lines at 406, 437, 545 and 578 nm, with the 545 nm line brightest. Hydrogen has no green line; helium’s strongest is yellow at 587.6 nm; mercury has 404.7, 435.8, 546.1 and a close yellow pair at 577.0 and 579.1 nm. Every reading is within 2 nm of a mercury line, and the pair blurs into one at this resolution, so the unknown is mercury vapor. A match needs the whole pattern, not one line.
What the patterns suggest. Each element gives its own lines, and the lines never move: hydrogen’s red line is at 656 nm in every tube, in every lab, and in light from distant stars. Since each wavelength is one photon energy, a hydrogen atom can give off only a few particular energies. Colored LEDs give a narrow band rather than a sharp line, and a white LED is a blue LED plus a yellow glowing coating. You will explain the lines with a model of the atom in 1.05. Reading. OpenStax Chemistry 2e, section 6.1 (line spectra), CC BY 4.0; line wavelengths from the NIST Atomic Spectra Database.
Guided Exercises ~15 min
Answer as you collect spectra; finish after clean-up. Useful values: c = 2.998 × 10⁸ m/s; h = 6.626 × 10⁻³⁴ J·s; 1 nm = 10−9 m.
Independent Practice ~10 min
Lab analysis, in your Color Notebook.
Calculate the photon energy for each of hydrogen's four visible lines (656.3, 486.1, 434.0, 410.2 nm). List them from lowest to highest energy and describe any pattern in the spacing.
Name two sources of error in your spectroscope readings and the direction each might shift a wavelength. Then explain why a flame test can tell sodium from strontium but a spectroscope could also detect both in one mixed flame.
Closure ~5 min
Every element has a line fingerprint. Next class: does the periodic table itself hide a pattern in the numbers?
Exit ticket: a firework designer's red star also shows a bright line at 589 nm in a spectroscope. What contaminant does that reveal, and why would it spoil the red?
Teacher notes
Materials (per pair): diffraction-grating film (about 1,000 lines/mm) or grating slides, card tubes or small boxes, black card, tape, scissors, a printed nm scale, colored pencils. Class: a spectrum-tube power supply with hydrogen, helium, neon and mercury tubes (teacher-operated only; mercury tube unlabeled as the unknown), a halogen or incandescent bulb, a white LED and red, green and blue LEDs on battery packs, a reference card of NIST lines. Hand spectroscopes can replace the paper build.
Two periods: day 1 build, calibrate and tubes; day 2 LEDs, unknown and CER. Run each tube for under a minute at a time and darken the room. No-lab alternative: projected NIST spectra images and the sample readings in worked example 2.
Listen for: “the grating adds the lines”; “neon is red so it only has one line.”
Support / stretch: give a pre-drawn scale strip. Answers: 656.3 nm 3.03, 486.1 nm 4.09, 434.0 nm 4.58, 410.2 nm 4.84 (× 10−19 J); the gaps shrink toward the violet. Stretch: use d sin θ = λ to find the angle for 546 nm with a 1,000 lines/mm grating (about 33°).