2.08 Freeze-Thaw Results and Version 2: Revising the Plan and the Recommendation
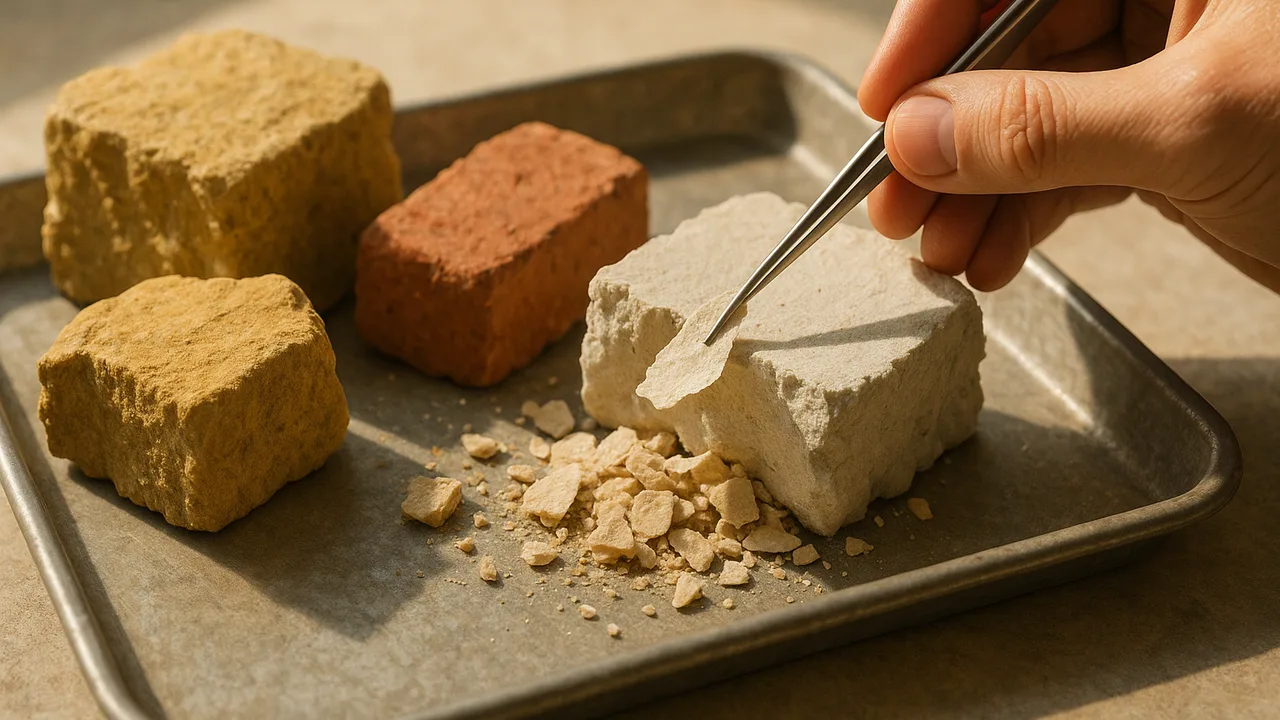
analyze the class freeze-thaw data, evaluate its accuracy and precision, judge what it says about water and rock in nature, revise the investigation plan, and build version 2 of the de-icer decision matrix.
- I can collect and record data that shows the effect of a property of water on Earth’s materials or surface processes.
- I can evaluate how accurate and precise my collected data is.
- I can judge whether my data can be used to infer how water affects processes in the natural world.
- I can revise my investigation plan to improve the accuracy and precision of my data if needed.
Phase 4: Build
Warm-Up ~5 min
Do Now. Record your final cycle data. Then look at the class table below and write the one result that surprised you most.
Plaster blocks kept wet at room temperature lost about 3% of their mass and never froze. What does that show?
Instruction ~10 min
The class data (sample data). Mass lost after six freeze–thaw cycles, as a percent of each sample’s starting dry mass. Three samples per cell. Water absorbed at the start: sandstone 5.8%, brick 7.8%, plaster 31.8% of dry mass.
| Material | Fresh water, frozen | 3% salt water, frozen | Fresh water, room temperature | Dry, frozen |
|---|---|---|---|---|
| Sandstone | 2.1, 2.6, 1.8 | 3.9, 4.4, 3.5 | 0.2, 0.1, 0.3 | 0.0, 0.1, 0.0 |
| Brick | 0.5, 0.7, 0.4 | 0.9, 1.2, 0.8 | 0.1, 0.0, 0.1 | 0.0, 0.0, 0.0 |
| Plaster | 5.8, 6.4, 9.9 | 7.2, 6.9, 7.6 | 2.9, 3.3, 3.1 | 0.1, 0.0, 0.1 |
Reading the pattern. Dry samples lost almost nothing, so cold alone does no damage: the water does. Wet samples that never froze lost little, except plaster, which dissolves. Freezing wet samples caused the most loss, and salt water made it worse for all three materials. Laboratory studies of concrete report the same surprise: surface scaling is often worst in weak salt solutions of a few percent, not in fresh water and not in very strong brine.
Worked example 1: means, range and an outlier. Grace averaged sandstone, fresh water, frozen: (2.1 + 2.6 + 1.8) ÷ 3 = 2.17%, range 0.8. Salt water: (3.9 + 4.4 + 3.5) ÷ 3 = 3.93%, range 0.9. The difference between means (1.8 points) is about twice either range, so it is likely real. Plaster, fresh, frozen: 5.8, 6.4 and 9.9. The 9.9 sits far from the other two. Her team’s notes showed that block had been dropped during cycle 3. A documented handling error justifies reporting the mean both ways: 7.37% with it, 6.1% without it. Deleting it silently would not be honest.
Worked example 2: accuracy. Brushed-off grains were weighed damp, so some of their mass was water: the losses are probably too high, a systematic error. Owen proposed weighing the whole sample after drying it in a low oven (about 60 °C for plaster, so the gypsum does not lose its own water) at the start and end. That measures the same quantity with less error.
From the lab to the roadside. Can the data tell us how water affects natural rock? Partly. The cause-and-effect pattern (wet + freezing → loss; salt → more loss) is strong and fits field observations of frost-shattered rock cuts. But the lab has limits: small samples with fresh-cut surfaces, a steady −18 °C freezer rather than nights that barely dip below zero, only six cycles against dozens per winter, and no traffic loads. A good report states the claim and its limits together.
Version 2 of the recommendation. Combine three evidence sets: freezing points (2.04), the heat and conductivity data (2.03), and today’s freeze–thaw results. Rebuild the decision matrix with the county’s criteria ranked by priority, score each treatment, and note which score would change if new evidence arrived.
Guided Exercises ~15 min
Use the class table.
Independent Practice ~10 min
Graph and recommend.
Make a bar graph of mean mass loss for each material and condition, with the range shown, and write a paragraph explaining the pattern from water's properties (density of ice, solvent power).
Build version 2 of your de-icer decision matrix: at least four criteria ranked by priority, all five treatments scored, and a two-sentence recommendation citing your freezing-point and freeze–thaw evidence.
🔎 Mini case study: Road salt and freshwater streams ~8 min
Chloride ions do not break down or evaporate. When snow melts, the chloride from road salt runs into ditches, streams and groundwater. Long-term monitoring in many snowy regions has found chloride levels in streams and lakes rising over decades, with winter and early-spring peaks in some urban streams high enough to stress fish, insects and the zooplankton that feed them.
Road agencies have responded in several ways: spraying brine before storms (anti-icing) so less solid salt is needed, calibrating spreaders, adding sticky additives so salt stays on the road, and using sand on low-traffic roads. Each choice trades safety, cost and environmental impact. None makes the chloride disappear, so using less is the main lever.
Think about it: Which of these responses could our class evidence support, and what would the county need to measure in its own trout stream to know if a change worked?
Closure ~5 min
Version 2 is built on three evidence sets. Next phase: the materials brief for the road department.
Exit ticket: name the piece of class data that most changed your recommendation, and how.
Teacher notes
Materials: final-cycle samples and the class data table, graph paper or spreadsheets, the version 1 decision matrices, low oven for the stretch revision (teacher only).
Timing: final readings 5 minutes, analysis 20, revision and matrix 20, case study 8.
Listen for: dropping the plaster outlier without a reason; “precise means accurate”; over-claiming from six cycles.
Support / stretch: a precision checklist (mean, range, outliers, cause). Stretch: compare the sandstone salt-water result with the concrete salt-scaling finding and propose a test of 0%, 3% and 15% salt solutions.