3.08 Gallery Critique and Version 2: A Harder Fall
give and use peer critique, test version 1 against the criteria in a harder fall, identify unexpected problems, and build a version 2 that still meets the criteria.
- I can systematically evaluate my device design by explaining my choices and comparing the design to the criteria and constraints.
- I can test my device to see how well it minimizes force during a collision and identify any unexpected effects or problems with its performance.
- I can use my test results to improve my device by increasing the impact time, reducing mass, or considering cost versus benefits.
Phase 4: Build
Warm-Up ~5 min
Do Now. A teen rider falls from a bike seat, not from 1.0 m but from about 1.5 m. By what factor does the energy the liner must absorb grow? What does that do to the crush distance needed at the same force?
A 60 g egg falls 1.5 m instead of 1.0 m. How much energy must the liner absorb?
Instruction ~10 min
Gallery critique. Post your version 1, its test data and your matrix on chart paper. Visitors leave three sticky notes: I like… (a strength backed by evidence), I wonder… (a question about an assumption), What if… (a change to test). Answer at least two notes in writing.
The stress test. Real falls are harder than the average test. Our stress case: the same 60 g egg dropped from 1.5 m (landing at 5.42 m/s with 0.882 J). A crushable structure pushes back at about the same plateau force whatever the drop, so a harder hit needs more crush distance, not a different force: dneeded = mgh/Fplateau. If the liner runs out of crush first, it bottoms out and the force spikes (illustrative values).
| Design | Plateau force (from 1.0 m test) | Crush needed at 1.5 m | Usable crush (80% of thickness) | Result |
|---|---|---|---|---|
| A. Honeycomb, 5.0 cm, 45 g | 16.8 N | 0.882/16.8 = 5.25 cm | 4.0 cm | Bottoms out: fails |
| C. Straws, 8.0 cm, 60 g | 11.8 N | 0.882/11.8 = 7.5 cm | 6.4 cm | Bottoms out: fails |
| Version 2: honeycomb, 7.0 cm, 63 g | 16.8 N | 5.25 cm | 5.6 cm | Passes, 0.35 cm spare, F ≈ 16.8 N |
Worked example 1: iterating. Priya’s team chose A as version 1. The stress test showed an unexpected problem: at 1.5 m the egg survived but cracked on one run in three, and the video showed the honeycomb fully flattened before the egg stopped. Changing one thing at a time, they made the honeycomb 7.0 cm thick. Version 2 passes with 0.35 cm to spare and adds 18 g, a trade-off they state openly: a bulkier liner that riders may like less.
Worked example 2: answering a critique. Sticky note: “I wonder if 1.5 m is too harsh.” Reply: “A rider’s head can start higher than 1.0 m when they fall from a seat, and the client’s top need is protection in a real fall. Designing for the harder case protects riders when the fall is worse than average.”
Systematic evaluation. For version 2, check every criterion and constraint in a table: force (16.8 N ≤ 20 N), survival (3 of 3), mass (63 g ≤ 100 g), size, cost, reusability (no) and waste (card is recyclable). Then name what you would change next and what it would cost.
Guided Exercises ~15 min
Run the stress test on your version 1, then answer.
Independent Practice ~10 min
Write version 2.
Describe your version 2: what changed and why, the stress-test result, and a criteria-and-constraints table with a pass or fail for each row. Explain one unexpected effect you saw and how version 2 handles it. Present your material in two formats (a labeled structure sketch and a force-distance graph).
🔎 Mini case study: Rating helmets with drop tests ~8 min
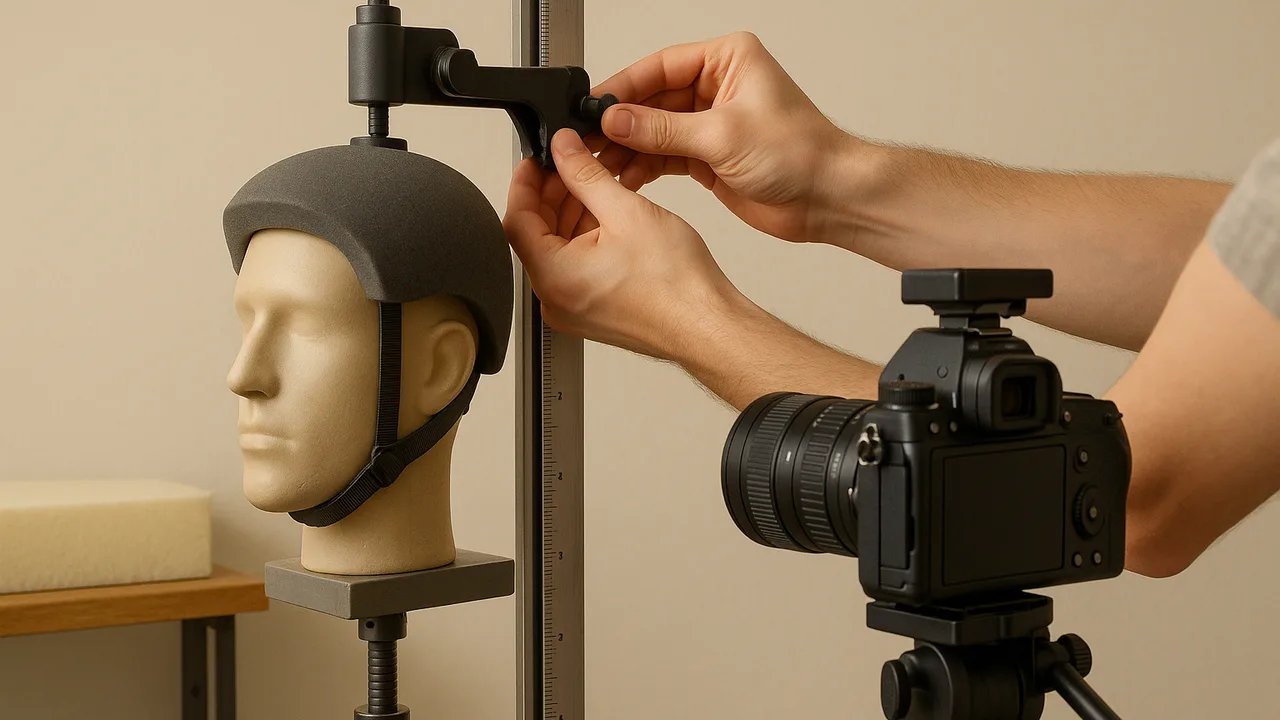
A federal standard tells helmet makers the minimum a bike helmet must do, but it does not say which passing helmet protects best. To answer that, researchers at Virginia Tech’s helmet lab began publishing STAR ratings for football helmets in 2011 and later added bicycle and other sport helmets.
The method is the physics of this unit. Each helmet is mounted on an instrumented headform and dropped or struck at several speeds and locations. Sensors record how quickly the head decelerates and rotates. The results are combined into a score that weights each impact by how often riders or players experience it, and the ratings are published free so families can compare. Some manufacturers have redesigned liners to earn better scores.
Think about it: How is a STAR-style rating like our weighted decision matrix and our stress test? What would you need to know before trusting a rating for teen bike-share riders?
Closure ~5 min
Version 2 is ready. Next phase: the full design report and defense for the client.
Exit ticket: explain, using impulse and crush distance, why your version 1 failed (or passed) the 1.5 m stress test and what version 2 changed.
Teacher notes
Materials: chart paper, three colors of sticky notes, the teams’ liners, sealed eggs, a 1.5 m marked drop line, goggles, trays.
Setup: 15 min gallery walk, 15 min stress test, 10 min case study, the rest for version 2. Stress-test values are illustrative; students drop from a standing position, never from a chair or table.
Listen for: vague critique; changing several things at once; ignoring bulk and mass as real trade-offs.
Support / stretch: provide a pass/fail table template. Stretch: find the drop height at which version 2 would just bottom out.