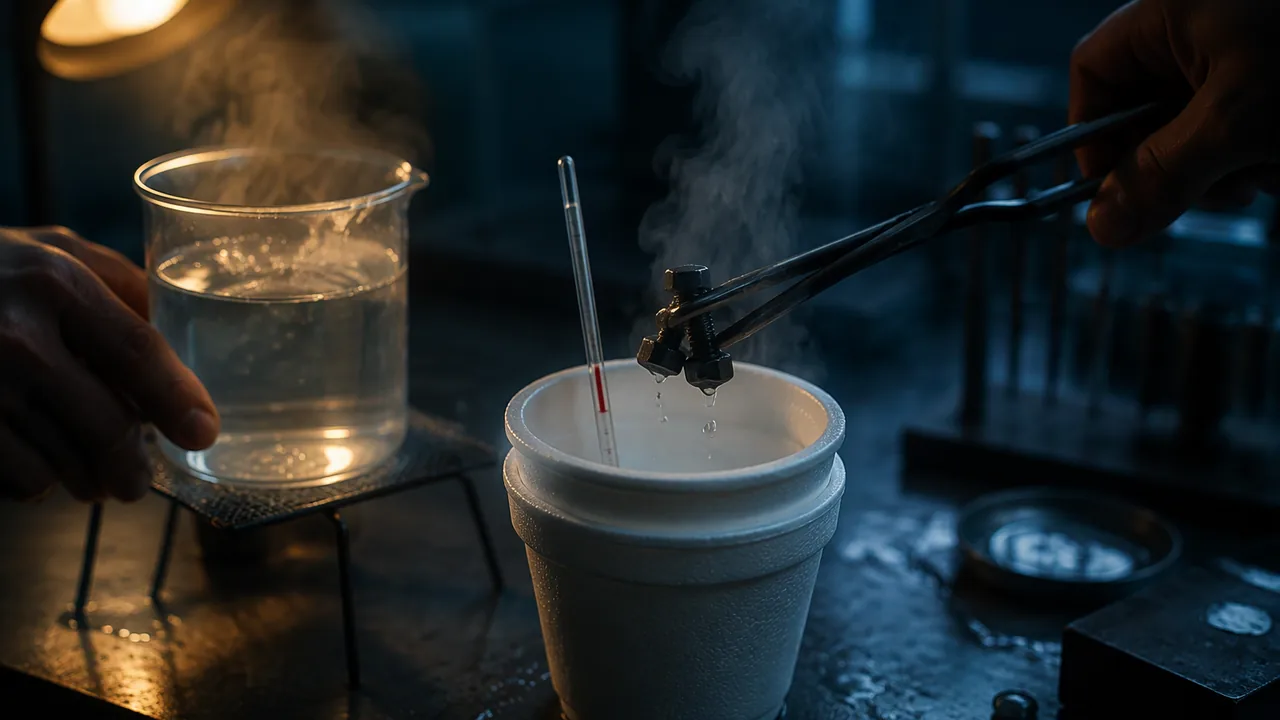
measure the specific heat of a metal with a foam-cup calorimeter, compare it with the accepted value, and explain the size and direction of experimental error.
Instruction
The idea. If a hot object and a cool object are sealed together in an insulated container, energy leaves the hot one and enters the cool one until they reach the same temperature (thermal equilibrium). If no energy escapes, the energy lost by the hot object equals the energy gained by the cool one. This is the method of mixtures, and it lets you measure the specific heat of a metal with a foam cup and a thermometer.
The equation. For a metal sample (mass mm, starting temperature Tm) dropped into water (mass mw, starting temperature Tw) that settles at Tf:
mmcm(Tm − Tf) = mwcw(Tf − Tw)
Both sides are written as positive quantities: energy lost equals energy gained. Solving for the unknown: cm = mwcw(Tf − Tw) / [mm(Tm − Tf)].
Worked example (illustrative data). A 300 g bundle of steel bolts is heated in adult-poured kettle water to 88.0 °C, then moved quickly into 200 g of water at 21.0 °C in a foam-cup calorimeter. The mixture settles at 30.0 °C.
- Energy gained by water: (0.200)(4186)(30.0 − 21.0) = 7,534.8 J.
- Temperature drop of the steel: 88.0 − 30.0 = 58.0 K.
- csteel = 7,534.8 / (0.300 × 58.0) = 433 J/(kg·K).
- The accepted value for iron and steel is 452 J/(kg·K), so the percent error is (433 − 452)/452 = -4.2%.
Predicting before measuring. Use the accepted value to predict the final temperature first: Tf = (mmcmTm + mwcwTw)/(mmcm + mwcw) = 30.34 °C. The measured 30.0 °C is lower, which is what you expect if some energy escaped: the bolts cooled in the air while being moved, and the cup and thermometer absorbed a little.
Why the result is so sensitive. The water only warmed by 9.0 K. A thermometer error of just ±0.1 °C on Tf moves the answer from 427 to 439 J/(kg·K), a spread of about ±1%. That is why you stir, read the highest steady temperature, use a large mass of metal and a small mass of water, and repeat the trial.
Direction of errors. Energy lost to the surroundings makes Tf too low and your c too low. Hot water clinging to the metal carries extra energy into the cup and makes c too high. Deciding which effect dominated is part of your analysis.
Misconception check. The metal and water end at the same temperature, but they do not change temperature by the same amount: water’s large specific heat means it changes far less for the same energy.
📖 Read for this lesson
The reading opens over the lesson; close it to come back to exactly where you were. The checks below draw on it.
Lab: Specific Heat of a Metal by the Method of Mixtures
Question. What is the specific heat capacity of aluminum, steel or copper hardware, measured by mixing hot metal with cool water, and how close does it come to the accepted value?
Materials
- Two nested foam cups with a cardboard lid (the calorimeter)
- Metal washers, bolts or nuts of one metal (aluminum, steel or copper) from a hardware drawer or store, 150-300 g, tied with string
- Digital kitchen thermometer or probe reading to 0.1 °C
- Kitchen scale (0.1 g if you have one; a 1 g scale works if you use at least 200 g of metal and 200 g of water)
- Hot water: the hottest tap water, or water from an electric kettle poured by a parent or guardian, in an insulated container such as a thermos jug (no open flames)
- Kitchen tongs, oven mitts, a measuring cup, paper towels
- Wear safety glasses throughout: you are handling hot water and hot metal. Work with a parent or guardian at home.
- Only an adult pours water from the kettle; move hot metal with tongs or by its string, wearing oven mitts.
- Keep hot water containers at the center of the table and wipe spills at once; no open flames anywhere in your work area. Nothing used in the lab is tasted, and washed hardware goes back to the tool drawer, not the kitchen.
Procedure
- Mass the metal sample. Tie it with string so it can be lifted.
- Place the sample in the insulated container; an adult covers it with kettle water (or fill it with the hottest tap water yourself). Wait at least 5 minutes, then record the water temperature: this is the metal’s starting temperature Tm.
- Mass the empty nested cups, add about 150-200 g of cool tap water, mass again, and record the water temperature Tw once it is steady.
- Predict Tf with the accepted specific heat before you mix.
- Lift the metal out, shake it once over the hot container, and lower it into the calorimeter within 3 seconds. Put the lid on with the thermometer through it.
- Stir gently and record the temperature every 10 s until it has stayed steady (or started to fall) for 60 s. Record the highest steady temperature as Tf.
- Repeat for a second trial (and a second metal if time allows). Compute c for each trial and the percent difference from the accepted value.
Data
| Trial | Metal | mm (kg) | Tm (°C) | mw (kg) | Tw (°C) | Predicted Tf (°C) | Measured Tf (°C) | c (J/(kg·K)) | % difference |
|---|---|---|---|---|---|---|---|---|---|
| Illustrative | steel | 0.300 | 88.0 | 0.200 | 21.0 | 30.3 | 30.0 | 433 | -4.2% |
| Illustrative | aluminum | 0.150 | 87.5 | 0.200 | 21.0 | 30.2 | 30.5 | 930 | +3.4% |
| 1 | |||||||||
| 2 |
Accepted values (OpenStax College Physics 2e, Table 14.1): aluminum 900, iron/steel 452, copper 387, water 4186 J/(kg·K). The two illustrative rows are not real measurements.
Analysis
- Claim, evidence, reasoning: state your measured specific heat and which accepted value it supports. Use your data table as evidence and conservation of energy as the reasoning.
- Uncertainty: redo the calculation with Tf 0.1 °C higher and 0.1 °C lower. How large is the resulting range in c, and does it include the accepted value?
- Sources of error: the illustrative steel result is low and the aluminum result is high. For each, name the error that most likely pushed it that way (energy lost to air, cup and thermometer; hot water carried on the metal) and explain the direction.
- Design: name one change to the procedure that would reduce your largest source of error, and predict how it would change your result.
If you cannot do this lab in person: If you cannot get the materials, use the PhET Energy Forms and Changes simulation (Intro screen) to put an iron and a brick block on heaters and watch the energy chunks, then complete every analysis question with the provided data set in this lesson’s reading, Three Metals in a Foam Cup (three complete recorded trials for steel, aluminum and copper, with temperatures every 10 s), instead of your own measurements. Say in your conclusion which route you used; both earn full credit.
Formative check
Work through these before moving on. They are not graded — they tell you whether the standard below has landed yet.
You drop 300 g of steel at 88 °C into 200 g of water at 21 °C. Where will the final temperature land?
Water (0.200 kg) warms from 21.0 °C to 30.0 °C, gaining J. The 0.300 kg of steel dropped from 88.0 °C, so its measured specific heat is about J/(kg·K).
If some energy escapes from the calorimeter to the room during the trial, the specific heat you calculate for the metal will come out too high.
Write your lab conclusion (claim, evidence, reasoning) in 150-200 words. Include your percent difference, your ±0.1 °C uncertainty range, and the one error source you think mattered most, with the direction it pushed your result.
How confident are you that you can measure a metal’s specific heat by the method of mixtures and explain the size and direction of my errors?
Practice
Work these on paper or in your notebook, then open Check your answer. Aim for all of Fluency and Application; try at least one Challenge.
Printable version: this unit’s practice workbook (PDF)
Fluency
Build speed and accuracy with the core skill.
- Convert 300 mL to L.
Check your answer
Answer: 0.3000 L - Convert 100 mL to L.
Check your answer
Answer: 0.1000 L - Convert 60 mL to L.
Check your answer
Answer: 0.0600 L - 0.30 kg of water at 70 °C is mixed with 0.50 kg of water at 10 °C in an insulated cup. Find the final temperature.
Check your answer
Answer: 32.5 °CSame substance: weighted average by mass. - Predict the final temperature when 0.250 kg of aluminum at 90 °C is dropped into 0.200 kg of water at 20 °C.
Check your answer
Answer: 34.8 °CTf = (macaTa + mwcwTw)/(maca + mwcw). - Which has the larger heat capacity: 0.30 kg of steel or 0.050 kg of water?
Check your answer
Answer: Water (209 J/K vs 136 J/K)Heat capacity = mc.
Application
Use the skill in context. Show your reasoning.
- A 0.200 kg copper sample at 95.0 °C is dropped into 0.150 kg of water at 21.0 °C; the mixture settles at 27.4 °C. Find the measured specific heat of copper and the percent difference from 387 J/(kg·K).
Check your answer
Answer: 297 J/(kg·K); −23.2%c = mwcw(Tf − Tw)/[m(T − Tf)] = 0.150 × 4186 × 6.4/(0.200 × 67.6) = 297. - For the copper trial, redo the calculation with Tf = 27.3 and 27.5 °C. What range of c does a ±0.1 °C reading error produce?
Check your answer
Answer: 292 to 302 J/(kg·K)The water’s small temperature rise makes the result sensitive. - A group’s measured specific heat is consistently too low. Name the most likely source of error and explain the direction.
Check your answer
Answer: Energy lost to the air, cup and thermometerLost energy never reaches the water, so Tf reads low and the calculated c is low.
Challenge
Stretch problems. Expect to think before you write.
- How much ice at 0 °C must be added to 0.300 kg of water at 25 °C to cool it to 5 °C? (Lf = 334,000 J/kg; the meltwater warms to 5 °C.)
Check your answer
Answer: 70.8 gEnergy removed from the water: 0.300 × 4186 × 20 = 25,116 J. Each kg of ice absorbs 334,000 + 4186 × 5 = 354,930 J.
Review
Keep earlier skills sharp.
- A device takes in 1200 J and delivers 196 J of useful energy. What is its efficiency, and where did the rest go?
Check your answer
Answer: 16.3%; the other 1004 J was transferred mostly as thermal energy to the surroundingsEfficiency = useful output / input × 100%. - A device takes in 2000 J and delivers 1416 J of useful energy. What is its efficiency, and where did the rest go?
Check your answer
Answer: 70.8%; the other 584 J was transferred mostly as thermal energy to the surroundingsEfficiency = useful output / input × 100%.
Three Metals in a Foam Cup: The Recorded Mixing Trials and the NIST Reference Values
SLS constructed teaching data set (illustrative, not laboratory measurements) following the Lesson 2.2 procedure for steel, aluminum and copper, with reference heat capacities from the NIST Chemistry WebBook (NIST-JANAF tables, Shomate equation at 298 K); retrieved Sept. 23, 2026 · SLS original, with public-domain NIST reference data
Why this reading. The lab’s data table has two illustrative rows and two blank ones, and its fallback route depended on a class data set someone else would hand you. Here is the complete recorded run of the lesson’s own procedure: three metals, the temperature read every 10 seconds after mixing, the prediction made before each mix, and the calculation. It is an SLS teaching data set constructed to behave like a foam-cup calorimeter, labeled illustrative; it is not a measurement from any named laboratory. The reference values at the end are from NIST. With this record you can answer every analysis question and write the conclusion without equipment.
Setup
Calorimeter: two nested foam cups, cardboard lid, digital probe reading to 0.1 °C. Balance to 0.1 g. Hot bath: kettle water in an insulated jug, sample held in it at least five minutes; the bath temperature is taken as the metal’s starting temperature Tm. Water for each trial: about 200 g of tap water, massed by difference. Transfer time from bath to cup: 2 to 3 seconds, one shake over the bath.
Table 1. The three trials
| Trial | Metal | mm (kg) | Tm (°C) | mw (kg) | Tw (°C) | Predicted Tf (°C) | Measured Tf (°C) |
|---|---|---|---|---|---|---|---|
| 1 | steel bolts | 0.300 | 88.0 | 0.200 | 21.0 | 30.3 | 30.0 |
| 2 | aluminum nuts | 0.150 | 87.5 | 0.200 | 21.0 | 30.2 | 30.5 |
| 3 | copper pipe fittings | 0.250 | 88.0 | 0.200 | 21.0 | 27.9 | 27.7 |
Predictions use the lesson’s accepted values (452, 900 and 387 J/(kg·K)) in Tf = (mmcmTm + mwcwTw)/(mmcm + mwcw). For copper: (0.250 × 387 × 88.0 + 0.200 × 4186 × 21.0)/(96.75 + 837.2) = 27.94 °C.
Table 2. Temperature every 10 s after the metal went in (°C)
| Seconds | 0 | 10 | 20 | 30 | 40 | 50 | 60 | 70 | 80 | 90 | 100 | 110 | 120 |
|---|---|---|---|---|---|---|---|---|---|---|---|---|---|
| Steel | 21.0 | 26.8 | 28.9 | 29.6 | 29.9 | 30.0 | 30.0 | 30.0 | 29.9 | 29.9 | 29.8 | 29.8 | 29.7 |
| Aluminum | 21.0 | 27.4 | 29.5 | 30.2 | 30.4 | 30.5 | 30.5 | 30.5 | 30.4 | 30.4 | 30.3 | 30.3 | 30.2 |
| Copper | 21.0 | 25.6 | 27.0 | 27.5 | 27.7 | 27.7 | 27.7 | 27.6 | 27.6 | 27.5 | 27.5 | 27.4 | 27.4 |
Read the highest steady value as Tf: 30.0, 30.5 and 27.7 °C. All three curves rise within 30 to 40 s, hold for about 30 s, then drift down by 0.1 °C every 20 to 30 s as the cup loses energy to the room. The drift is the calorimeter’s leak made visible, and it tells you which way the leak pushes Tf.
Worked calculation, steel
Energy gained by water: (0.200)(4186)(30.0 − 21.0) = 7,534.8 J. Temperature drop of the steel: 88.0 − 30.0 = 58.0 K. c = 7,534.8/(0.300 × 58.0) = 433 J/(kg·K); against the lesson’s 452, the percent difference is (433 − 452)/452 = −4.2%. Aluminum: 7,953.4 J gained, 57.0 K drop, c = 7,953.4/(0.150 × 57.0) = 930 J/(kg·K), +3.4%. Copper: 5,609.2 J, 60.3 K, c = 5,609.2/(0.250 × 60.3) = 372 J/(kg·K), −3.9%.
Sensitivity to ±0.1 °C. For steel, Tf = 30.1 gives 7,618.5/(0.300 × 57.9) = 439 J/(kg·K); 29.9 gives 7,451.1/(0.300 × 58.1) = 428. A thermometer error of one tenth of a degree moves the result by about ±1.3%; the −4.2% difference is three times that, so it is not thermometer noise.
The reference values, and where they come from
The NIST Chemistry WebBook gives solid-phase heat capacities at 298 K from the NIST-JANAF Thermochemical Tables (Shomate equation): aluminum 24.21 J/(mol·K) with molar mass 26.982 g/mol, so 897 J/(kg·K); iron 25.10 J/(mol·K), 55.845 g/mol, 449 J/(kg·K); copper 24.47 J/(mol·K), 63.546 g/mol, 385 J/(kg·K); and liquid water 75.37 J/(mol·K), 18.015 g/mol, 4,184 J/(kg·K). The lesson’s 900, 452, 387 and 4,186 are conventional textbook roundings of the same physics; the differences (0.3 to 0.7%) are smaller than the experiment’s uncertainty. Steel is mostly iron with a little carbon, so pure-iron values are the right comparison for bolts. Against NIST, the three results are −3.6% (steel), +3.7% (aluminum) and −3.4% (copper).
Directions of error
Energy that escapes to the room, the cup and the probe never reaches the water, so Tf reads low and c comes out low: the steel and copper results. Hot bath water carried on the metal adds energy to the cup that is credited to the metal, so c comes out high: aluminum nuts have threads that hold water, which is the likely story of trial 2. The metal also cools in the air during the transfer, which lowers its true Tm below the bath reading and pushes c low. Deciding which effect dominated a trial is the analysis.
Your turn
- Recompute c for all three trials and the ±0.1 °C range for aluminum and copper. Does each range include the NIST value? The lesson’s value?
- Trials 1 and 3 came out low and trial 2 high. Name the error most likely responsible for each and state its direction, using Table 2’s drift where it helps.
- Propose one change to the procedure that would shrink the largest error, and predict numerically how it would move the steel result.
- Write the 150–200 word conclusion (claim, evidence, reasoning) for the steel trial, quoting the measured c, its range, the percent difference and the dominant error.
Sources: NIST Chemistry WebBook, Aluminum, condensed phase thermochemistry data (webbook.nist.gov); NIST Chemistry WebBook, Iron, condensed phase thermochemistry data (webbook.nist.gov); NIST Chemistry WebBook, Copper, condensed phase thermochemistry data (webbook.nist.gov); NIST Chemistry WebBook, Water, condensed phase thermochemistry data (webbook.nist.gov)