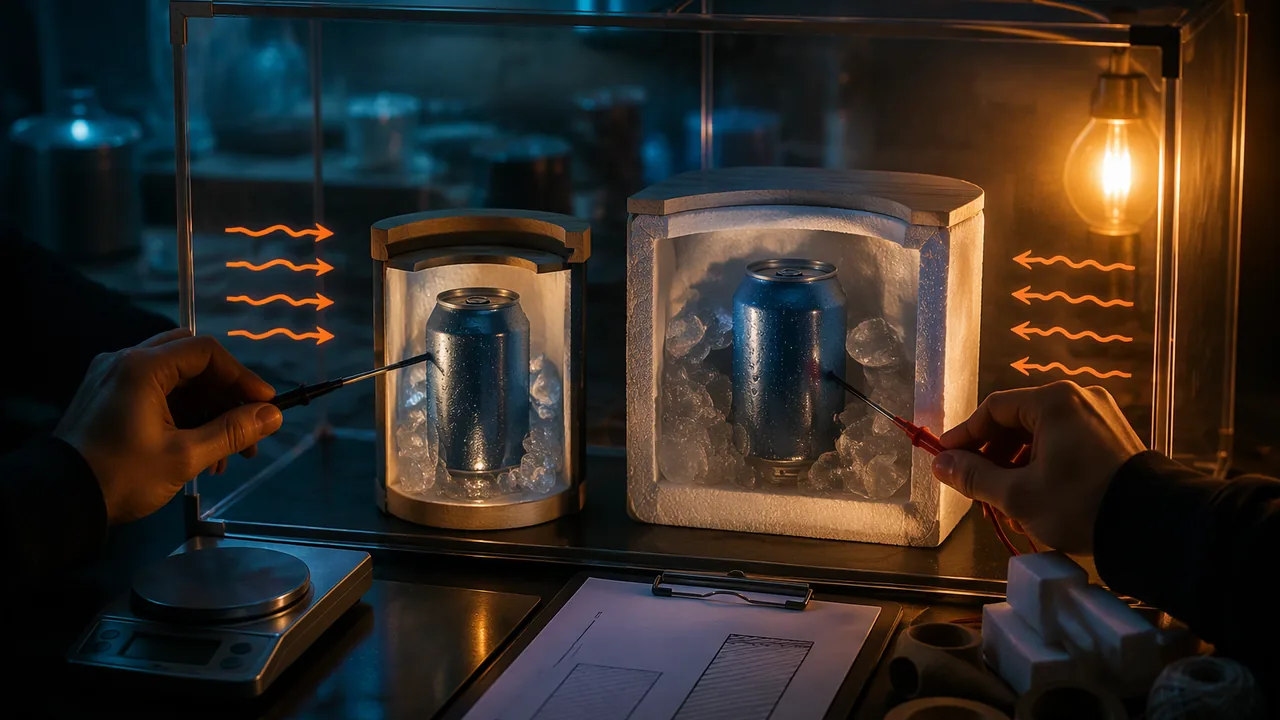
design, build and test an insulated container against prioritized criteria and constraints, model its energy flows, and evaluate trade-offs with measured data.
Instruction
The design challenge. On a Missouri summer afternoon, a canned drink left in a car or a backpack warms quickly: St. Louis’s normal July high is 89.6 °F (32.0 °C), and in the heat wave of July 2012 the daily highs averaged 98.6 °F (37.0 °C). You design, build and test a container that keeps a 355 mL can cold for as long as possible, or (option B) a small passive-cooling model house that stays coolest under a lamp “sun”. You will specify criteria and constraints (9-12.ETS1.A.1), test with measured data, and evaluate trade-offs among your designs (9-12.ETS1.B.1).
Criteria and constraints. A criterion is a measurable goal: “the drink stays below 10 °C for at least 90 minutes in a 38 °C test box.” A constraint is a limit: materials cost under $5, mass under 400 g, fits in a backpack side pocket, reusable, no electricity. Prioritize them: which criterion would you give up a little of to meet another?
An energy-flow model to guide design. Model the container as a foam box, 15 cm on a side, with walls 2.0 cm thick. Its surface area is 6 × 0.152 = 0.135 m2. With 38 °C outside and 4 °C inside, the conduction rate is P = kAΔT/d = (0.033)(0.135)(34)/0.020 = 7.57 W. If the box holds 200 g of ice, melting it takes Q = mLf = (0.200)(334,000) = 66,800 J, so the ice lasts about 66,800/7.57 = 8,820 s, or 2.5 hours. Doubling the wall thickness halves P and doubles the time to 4.9 hours, but makes the box bulkier and heavier. That is a trade-off.
Why ice is so effective. Cooling the can itself (0.355 kg, treated as water) from 30 °C to 4 °C removes (0.355)(4186)(26) = 38,637 J. Ice absorbs 334,000 J/kg just melting, plus 4186 J/kg for each kelvin its meltwater then warms, so about 110 g of ice melting and warming to 4 °C would do the job (ignoring leaks). Phase change stores a lot of energy at a constant temperature.
What your model leaves out. The slab formula ignores corners, lids and seams (where most leaks happen), radiation from a hot car interior, and the air films on the surfaces. Your measured warming curve tests the model: if your drink warms faster than predicted, find the leak.
Evaluating trade-offs. Compare at least two designs in a decision matrix: score each against weighted criteria (performance, cost, mass, size, reusability, environmental impact of the materials) and justify the weights. A reflective outer layer may cut radiation in sunlight but add cost; a thicker wall helps conduction but not a leaky lid. Report which design you would recommend and what you gave up.
Communicating. Your final report includes the problem statement with prioritized criteria and constraints, a labeled design drawing, an energy-flow diagram of the system, your predicted and measured warming curves, the decision matrix, and a paragraph linking the molecular structure of your insulating material to its function.
📖 Read for this lesson
The reading opens over the lesson; close it to come back to exactly where you were. The checks below draw on it.
Formative check
Work through these before moving on. They are not graded — they tell you whether the standard below has landed yet.
Which is a criterion rather than a constraint for the cold-drink container?
A foam box leaks 7.57 W. 200 g of ice needs J to melt, so it lasts about hours.
Draft your decision matrix: list at least four weighted criteria, score your two designs and the bare control, and write two sentences explaining your heaviest weight.
How confident are you that you can specify criteria and constraints, predict and test an insulated design, and evaluate trade-offs with data?
Unit 2 checkpoint
Do this before you start the task. It covers the whole unit and tells you what to review first.
Temperature measures
Warming 0.50 kg of water by 30 K takes J.
25 °C is K.
In a calorimeter, if energy leaks to the room, the measured specific heat of the metal comes out too high.
Why does a small mass of water barely change temperature when hot metal is dropped in?
The Carnot efficiency between 600 K and 300 K is %.
A refrigerator moving heat from cold to hot violates the second law.
Which is the best evidence for the second law from the mixing lab?
A gas at 300 K and 100 kPa is heated to 360 K at constant volume. Its pressure becomes kPa.
Foam insulates mainly because trapped still gas conducts poorly and cannot circulate.
In the Keep It Cold task, ‘costs less than $5’ is a
Melting 0.10 kg of ice at 0 °C absorbs J.
Submit: Keep It Cold in a Missouri Summer — design report (1,200-1,600 words) with test data, plus a design defense
Task: Design, build and test a container that keeps a 355 mL can of cold water (or drink) below 10 °C for as long as possible in a warm test environment (a sunny spot outdoors or a lamp-heated box at about 35-40 °C, the range of a Missouri heat-wave afternoon). Option B: build a shoebox model house and test roof color, insulation and shading to keep its inside air coolest under a lamp. Test at least two versions of your design against a bare control.
Your report must include: prioritized criteria and constraints with numbers (9-12.ETS1.A.1); a labeled design drawing; an energy-flow model naming conduction, convection and radiation paths; a predicted time from P = kAΔT/d and latent heat where you use ice; measured warming curves for each version and the control; a weighted decision matrix and trade-off evaluation (9-12.ETS1.B.1); and an explanation of why your insulating material’s molecular structure works (9-12.PS1.A.4).
Safety: goggles when handling water near lamps; lamps under 60 W incandescent-equivalent and never touching cardboard; no dry ice or chemical cold packs you open; never leave a test inside a parked car; a parent or guardian checks the lamp setup before you leave it running. If you cannot build at home, complete Stages 2 and 3 with the illustrative test record in this lesson’s reading and say so in your report.
Submission workflow
- Stage 1 — Plan. Problem statement, prioritized criteria and constraints with numbers, two sketched designs, the model prediction for each, and the test procedure (control, measurement interval, test environment).
- Stage 2 — Reviewed draft. Build and test version 1. Ask a parent, guardian or another RLP student to check your calculations and try to find a leak or flaw in your test; if no reviewer is available, complete the self-check instead (recompute every number from the raw readings, compare each predicted time with the measured one, and list every seam, lid and corner where energy could enter). Submit the review or self-check notes and your revision plan.
- Stage 3 — Revised final. Test the improved version, compare prediction with measurement, complete the decision matrix and the full report.
- Stage 4 — Presentation or defense. A 4-minute design defense, live or recorded (equal credit), answering one question about your trade-offs and one about your energy model.
How it is scored
| Criterion | What proficient looks like |
|---|---|
| Criteria and constraints (9-12.ETS1.A.1) | Measurable, prioritized criteria and realistic constraints tied to the Missouri summer heat problem. |
| Energy-flow model (9-12.PS3.B.1, CCC.5) | Correct model of all transfer paths, with a quantitative prediction from conduction and latent heat. |
| Testing and data (SEP.3, SEP.4) | Controlled test with a bare control, repeated readings, clear warming curves and uncertainty. |
| Trade-off evaluation (9-12.ETS1.B.1) | Weighted decision matrix with justified weights; recommendation names what was given up. |
| Materials explanation (9-12.PS1.A.4) | Explains the insulating material’s function from its molecular-level structure. |
| Communication (RST.11-12.3, MP.4) | Clear, organized report with a procedure others could follow; defense answers questions accurately. |
Keep It Cold in a Missouri Summer: The Heat You Are Designing Against, the Model’s Inputs and an Illustrative Test Record
NOAA NCEI 1991-2020 U.S. Climate Normals and Global Summary of the Month (July 1995-2025), St. Louis Lambert Intl (USW00013994) and Kansas City Intl (USW00003947); NIST Chemistry WebBook (water); SLS constructed test record (illustrative, generated from Newton’s law of cooling) and decision matrix; retrieved Nov. 5, 2026 · SLS original, with public-domain NOAA and NIST data
Why this reading. The task is set in Missouri summer heat and asks for a predicted time, measured warming curves for two versions and a control, a decision matrix and a materials explanation. The lesson gives the model and one worked prediction. This reading supplies the rest: the real St. Louis and Kansas City temperatures the criterion should be set against (NOAA climate normals and 31 years of July records), the reference property values the model uses, and a complete illustrative test record, two versions and a bare control in a 38 °C test box, so that a student who cannot build can still complete the comparison of prediction with measurement. The test record is SLS teaching data, generated from Newton’s law of cooling and labeled illustrative; it is not a measurement.
1. How hot is a Missouri summer afternoon?
NOAA’s 1991–2020 climate normals give a July mean daily maximum of 89.6 °F (32.0 °C) at St. Louis Lambert International Airport (station USW00013994) and 88.3 °F (31.3 °C) at Kansas City International Airport (USW00003947); the August normals are 88.3 °F (31.3 °C) and 87.1 °F (30.6 °C). Normals hide the heat waves, so the table below lists, for each July from 1995 to 2025, the average of the daily highs and the single hottest reading (NOAA Global Summary of the Month).
| July | St. Louis: average daily high (°F) | St. Louis: hottest day (°F) | Kansas City: average daily high (°F) | Kansas City: hottest day (°F) |
|---|---|---|---|---|
| 1995 | 90.3 | 101 | 88.6 | 99 |
| 1996 | 84.9 | 96 | 84.4 | 97 |
| 1997 | 90.1 | 99 | 87.6 | 98 |
| 1998 | 86.9 | 98 | 85.6 | 98 |
| 1999 | 92.0 | 103 | 91.1 | 103 |
| 2000 | 85.6 | 95 | 85.7 | 94 |
| 2001 | 89.2 | 99 | 89.5 | 98 |
| 2002 | 92.0 | 100 | 92.8 | 103 |
| 2003 | 89.1 | 97 | 92.7 | 102 |
| 2004 | 85.9 | 97 | 83.9 | 95 |
| 2005 | 89.7 | 103 | 89.5 | 99 |
| 2006 | 92.7 | 101 | 92.3 | 104 |
| 2007 | 87.8 | 96 | 87.1 | 93 |
| 2008 | 88.5 | 99 | 86.6 | 96 |
| 2009 | 84.0 | 93 | 82.9 | 93 |
| 2010 | 91.0 | 97 | 88.8 | 94 |
| 2011 | 94.9 | 103 | 92.9 | 102 |
| 2012 | 98.6 | 108 | 98.2 | 106 |
| 2013 | 86.3 | 98 | 87.2 | 98 |
| 2014 | 86.2 | 99 | 83.8 | 96 |
| 2015 | 88.9 | 100 | 85.9 | 96 |
| 2016 | 90.0 | 101 | 87.6 | 96 |
| 2017 | 94.3 | 108 | 88.7 | 98 |
| 2018 | 89.7 | 100 | 89.3 | 100 |
| 2019 | 90.0 | 97 | 87.7 | 97 |
| 2020 | 91.0 | 97 | 88.1 | 94 |
| 2021 | 88.1 | 97 | 88.1 | 98 |
| 2022 | 92.2 | 105 | 89.0 | 101 |
| 2023 | 91.1 | 101 | 87.3 | 99 |
| 2024 | 88.4 | 98 | 86.2 | 96 |
| 2025 | 90.8 | 97 | 88.6 | 96 |
St. Louis reached 100 °F (37.8 °C) in 13 of the 31 Julys and Kansas City in 8. July 2012 was the hottest in both cities: St. Louis’s daily highs averaged 98.6 °F (37.0 °C), with 28 days at 90 °F or above and a peak of 108 °F (42.2 °C); Kansas City’s averaged 98.2 °F (36.8 °C) with a peak of 106 °F (41.1 °C). A closed car or a backpack in the sun runs hotter than the air. A test environment of 35–40 °C, as the task specifies, is therefore a fair stand-in for a Missouri heat-wave afternoon, and 38 °C (100 °F) is used below.
2. Property values used in the model
| Quantity | Value used | Source |
|---|---|---|
| Specific heat of water | 4,186 J/(kg·K) (NIST WebBook: 4,184) | lesson value; NIST Chemistry WebBook |
| Latent heat of fusion of ice | 334,000 J/kg | lesson value (a standard reference figure; not retrieved from an agency source for this reading) |
| Conductivity, polystyrene foam | 0.033 W/(m·K) | lesson’s approximate value |
| Conductivity, still air | 0.026 W/(m·K) | lesson’s approximate value |
| Sunlight at noon, clear sky | about 1,000 W/m2 | lesson’s approximate value |
The worked prediction. Foam box 15 cm on a side, walls 2.0 cm: area 6 × 0.152 = 0.135 m2; with 38 °C outside and 4 °C inside, P = (0.033)(0.135)(34)/0.020 = 7.57 W. 200 g of ice needs (0.200)(334,000) = 66,800 J to melt, so it lasts 66,800/7.57 = 8,820 s = 2.5 hours; 4.0 cm walls give 4.9 hours. Cooling the can from 30 to 4 °C removes (0.355)(4186)(26) = 38,637 J, which about 110 g of ice supplies as it melts and its meltwater warms to 4 °C.
3. Illustrative test record: two versions and a control at 38 °C
A 355 mL can of water, chilled to 4.0 °C, placed in a lamp-heated cardboard test box held at 38.0 ± 0.5 °C, temperature read with a probe through the lid every 15 minutes. Control: the bare can. Version 1: the can in a single-wall foam sleeve cut from a shipping box, 2.0 cm thick, lid loose. Version 2: a 2.0 cm foam box with a taped foam lid and a foil outer wrap. No ice in either version, so this record tests the insulation alone; the ice calculation above is a separate prediction. The three curves are generated from Newton’s law of cooling with k = 0.035, 0.010 and 0.0055 per minute and rounded to 0.1 °C.
| Minutes | Control, bare can (°C) | Version 1, sleeve (°C) | Version 2, box + lid + foil (°C) |
|---|---|---|---|
| 0 | 4.0 | 4.0 | 4.0 |
| 15 | 17.9 | 8.7 | 6.7 |
| 30 | 26.1 | 12.8 | 9.2 |
| 45 | 31.0 | 16.3 | 11.5 |
| 60 | 33.8 | 19.3 | 13.6 |
| 75 | 35.5 | 21.9 | 15.5 |
| 90 | 36.5 | 24.2 | 17.3 |
| 105 | 37.1 | 26.1 | 18.9 |
| 120 | 37.5 | 27.8 | 20.4 |
| 135 | 37.7 | 29.2 | 21.8 |
| 150 | 37.8 | 30.4 | 23.1 |
| 165 | 37.9 | 31.5 | 24.3 |
| 180 | 37.9 | 32.4 | 25.4 |
Time to cross 10 °C, the task’s criterion: control about 5.5 min; version 1 about 19.4 min; version 2 about 35 min. Read those off the table by interpolating between rows, then check them with t = −ln[(38 − 10)/(38 − 4)]/k = 0.1942/k. Version 2 keeps the drink under 10 °C six times as long as the bare can and not quite twice as long as version 1; the lid and seams were where version 1 leaked. Neither reaches the 90 minutes the lesson’s example criterion asked for. With 200 g of ice inside version 2, the model predicts the ice alone holds the interior near 0 °C for about 2.5 hours before the water starts to warm, which is why the ice is in the design.
4. A decision matrix with figures
Weights are a design choice; these are one defensible set. Scores run 1 (poor) to 5 (best) and are multiplied by the weight.
| Criterion (weight) | Control | Version 1 | Version 2 | Basis |
|---|---|---|---|---|
| Time below 10 °C (4) | 1 | 3 | 5 | 5.5, 19.4 and 35 min |
| Cost (2) | 5 | 4 | 3 | $0, about $1 of scrap foam, about $3 with tape and foil |
| Mass (2) | 5 | 4 | 3 | 0 g, 60 g, 190 g of container |
| Fits a side pocket (1) | 5 | 4 | 2 | bare, 7 cm wide, 19 cm cube |
| Reusable, low-impact materials (1) | 5 | 3 | 3 | none; recycled foam; foam + foil |
| Weighted total | 34 | 35 | 37 |
Version 2 wins on the heaviest weight and gives up mass and size to do it; that is the trade-off the report must name. A version 3 that kept version 2’s lid but thinned the walls to 1.0 cm would halve the mass and, by the slab model, double the conduction: the matrix tells you whether that trade is worth it.
Your turn
- Fit k for each curve from two rows of Table 3 using ln[(38 − T)/(38 − 4)] and confirm the three crossing times.
- Predict, with the slab model, the conduction into version 2 at 38 °C when the interior is at 4 °C, and compare with the 7.57 W worked example. Then explain why the measured curve warms faster than a 7.57 W leak alone would predict (the can’s 0.355 kg of water has heat capacity 1,486 J/K).
- Re-weight the matrix for a student who bikes to a summer job and must carry the container in a pocket. Does the winner change?
- Write the materials paragraph: why closed-cell foam insulates, in terms of still gas, cell walls and convection, using the conductivity values in section 2.
Sources: NOAA NCEI, 1991-2020 monthly normals, St. Louis Lambert Intl Airport (USW00013994) (ncei.noaa.gov); NOAA NCEI, 1991-2020 monthly normals, Kansas City Intl Airport (USW00003947) (ncei.noaa.gov); NOAA NCEI, Global Summary of the Month, St. Louis and Kansas City, July and August 1995-2025 (ncei.noaa.gov); NIST Chemistry WebBook, Water, condensed phase thermochemistry data (webbook.nist.gov)