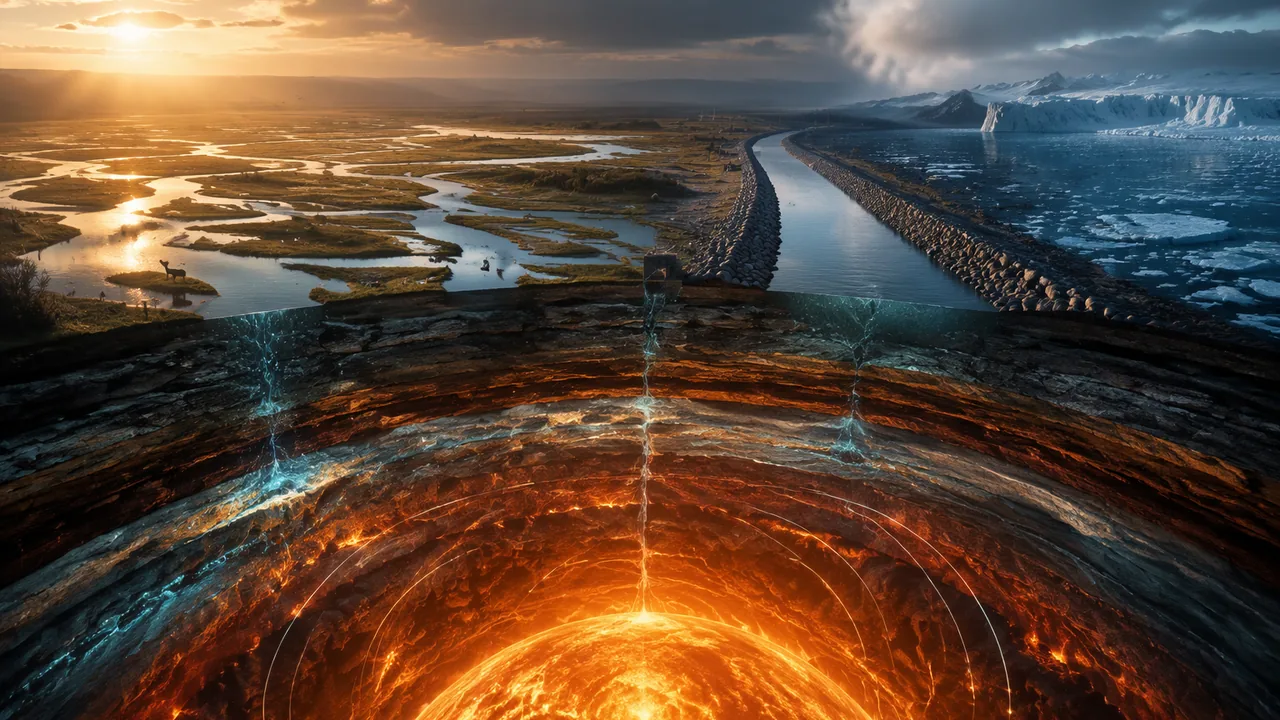
develop a model of Earth’s interior from seismic-wave, density and heat-flow evidence in which mantle convection cycles matter; use a Stefan-Boltzmann energy-balance model to describe how variations in sunlight, albedo, orbit and greenhouse gases change climate; and analyze data to show how one change to Earth’s surface, such as melting sea ice or a channelized Missouri River, creates changes in other Earth systems.
Instruction
Two engines and one river. Before engineers rebuilt it, the lower Missouri River was a shallow, shifting, braided river from 1,200 feet to 2 miles wide. Rock dikes and revetments squeezed it into a channel 600 to 1,100 feet wide and, by the Missouri Department of Conservation’s count, 127 miles shorter between Sioux City and St. Louis. That one change to Earth’s surface rippled into floods, wetlands and wildlife. This lesson follows energy through Earth’s two engines, the slow heat from inside that drives the plates and the sunlight that drives climate, and then follows a few surface changes as they spread from one Earth system to the others.
Seeing inside with earthquake waves. The deepest hole ever drilled, on Russia’s Kola Peninsula, reaches only about 12 km, so the interior is known from indirect evidence. USGS explains that compressional (P) waves travel through solids and liquids, but shear (S) waves do not pass through the outer core, and P waves slow sharply there: the outer core is liquid. At the mantle-core boundary wave speed drops about 30% and density jumps about 30%. Between 100 and 200 km down the rock is near its melting point and waves slow slightly; this soft layer is what the plates ride on. Gravity gives two more clues. Earth’s mean density is 5,513 kg/m3, about twice that of surface rock, and its moment of inertia factor is 0.3308, below the 0.4 of a uniform ball, so mass is concentrated toward the center: an iron-rich core nearly twice as dense as the mantle. That is the one-dimensional model, layers sorted by density, with the core about 15% of Earth’s volume, the mantle 84% and the crust 1%.
The heat engine. Heat flows out of Earth at 44.2 ± 1.0 terawatts. A 2011 study that combined geoneutrino measurements from detectors in Japan and Italy found that radioactive decay of uranium, thorium and potassium supplies about half of it; the rest is heat left from Earth’s formation. Spread over Earth’s surface, 4π(6.371 × 10⁶ m)2 = 5.10 × 10¹⁴ m2, that is only 0.087 W/m2. It is enough to keep the mantle convecting. USGS compares the mantle to a pot of thick soup: hot rock rises, spreads, cools and sinks. Mantle rock is solid, but under heat and pressure it flows over millions of years, and plates move a few centimeters a year. Most scientists now favor slab pull, the sinking of cold, dense plate edges, as the main force driving plates. The cycle carries matter both ways, mantle rock up to make new crust at ridges and old crust down at subduction zones. Missouri has felt both ends of that engine: USGS links the St. Francois Mountains’ 1.48-billion-year volcanism to mantle upwelling, and the New Madrid Seismic Zone sits in the middle of a plate that convection pushes and pulls.
The climate engine: a radiation balance. Sunlight arrives at 1,361 W/m2; averaged over a spinning sphere that is one-fourth, 340 W/m2. NASA lists Earth’s Bond albedo as 0.294, so Earth absorbs 340 × 0.706 = 240 W/m2, about 2,800 times the interior heat flow. Climate is set by sunlight in and infrared out. In balance, σT4 = S(1 − A) ÷ 4, with σ = 5.670 × 10⁻⁸ W m−2 K−4 (NIST), so T = [S(1 − A) ÷ 4σ]1/4 = 255 K. Earth’s real average is 288 K (NASA), whose surface radiates σ(288)4 = 390 W/m2. The 33 K difference is the greenhouse effect: water vapor and carbon dioxide absorb outgoing infrared and send part of it back down. Change any input and the balance moves. Raise the albedo to 0.31 and T falls to 253.7 K; lower it to 0.28 and T rises to 256.4 K. A Sun 0.1% brighter warms the model only 0.06 K.
Slow variations in energy flow. NASA explains three orbital (Milankovitch) cycles: the orbit’s shape changes over about 100,000 years, the tilt between 22.1° and 24.5° over about 41,000 years, and the direction of the axis over about 23,000 years. Today Earth gets about 6.8% more sunlight in early January, at its closest, than in early July (NASA’s perihelion and aphelion distances give (152.100 ÷ 147.095)2 = 1.069). These cycles redistribute sunlight by season and latitude and paced the Ice Ages, about every 41,000 years before 800,000 years ago and about every 100,000 years since. NASA also notes that today’s orbital positions alone predict slow cooling. Instead carbon dioxide rose from about 280 ppm to 421 ppm (2023), and global temperature rose more than 1 °C since 1850. NOAA’s St. Louis record agrees in direction: decade averages went from 55.7 °F in the 1960s to 59.2 °F in 2016-2025, a rise of 3.5 °F (1.9 K), though one city station also records the warmth of a growing city.
Feedback 1: ice and albedo. One surface change can feed back on the energy that caused it. The National Snow and Ice Data Center reports that sea ice reflects 50 to 70% of sunlight, while the open ocean around it reflects only 6%. Where ice melts, the surface goes from absorbing 30-50% to absorbing 94% of the sunlight, 1.9 to 3.1 times more energy. The water warms, more ice melts, and the warming grows: a reinforcing (positive) feedback that links the cryosphere, hydrosphere and atmosphere. Run backward, spreading ice raises albedo and cools the planet further, which helped deepen the Ice Ages.
Feedback 2: a channelized Missouri River. Beginning in 1912, Congress directed the U.S. Army Corps of Engineers to make the Missouri safer to navigate and to protect nearby land from floods, the work that became the Bank Stabilization and Navigation Project: a 9-foot-deep, 300-foot-wide navigation channel. The Missouri Department of Conservation reports a loss of 522,000 acres of water and land habitat, two-thirds of it in Missouri, and USGS scientists describe the result as a narrow, swift, deep channel. The changes did not stop at the channel. Downstream, floods now reach higher stages than before river engineering, which USGS researchers attribute to constriction by revetments and levees, while the bed has cut down in places and low-flow stages have dropped. The physics is continuity: discharge Q = (width)(depth)(speed), so the same flood forced through half the width must flow deeper, faster or both. The geosphere change (a fixed channel) changed the hydrosphere (flood heights) and the biosphere (lost sandbars and wetlands), and in 1986 Congress authorized a mitigation project to buy back floodplain land.
At home. Do one convection demonstration from the reading: a pot of water with ground pepper on a stove, with an adult at the stove the whole time, or the no-heat route, a colored ice cube melting in a glass of warm tap water. For albedo, set two identical cups of water in the sun for 30 minutes, one wrapped in white paper and one in black, and compare them with a kitchen thermometer; on a cloudy day, use the reading’s energy-balance spreadsheet instead.
📖 Read for this lesson
The reading opens over the lesson; close it to come back to exactly where you were. The checks below draw on it.
Formative check
Work through these before moving on. They are not graded — they tell you whether the standard below has landed yet.
Missouri standard: 9-12.ESS2.A.3
Seismographs far from an earthquake record P waves (some delayed and bent) but no direct S waves that have passed through Earth’s center. What does this evidence show?
Missouri standard: 9-12.ESS2.A.3
Heat leaves Earth’s interior at 44.2 × 10¹² W through a surface of 5.10 × 10¹⁴ m2, an average heat flow of about W/m2 (round to three decimal places).
Missouri standard: 9-12.ESS2.A.4
In the model T = [S(1 − A) ÷ 4σ]1/4 with S = 1,361 W/m2, Earth’s albedo rises from 0.294 to 0.31 as ice sheets spread. What happens to the balance temperature?
Missouri standard: 9-12.ESS2.A.2
Narrowing the Missouri River with dikes and revetments changed only the river’s channel; it had no measurable effect on flood heights or on habitat.
Missouri standard: 9-12.ESS2.A.2, 9-12.ESS2.A.3, 9-12.ESS2.A.4
Part 1, interior. Draw a cross-section of Earth with crust, mantle, outer core and inner core, and label each with one piece of evidence (seismic waves, density, moment of inertia or heat flow). Add convection arrows from your home demonstration (stovetop with an adult, or the ice cube) and write one way the demonstration is a good model of the mantle and one way it is not. Part 2, energy balance. In a spreadsheet, compute T for the base case and three what-if runs (albedo 0.31, albedo 0.28, a Sun 0.1% brighter). Compare each change with the St. Louis rise of 1.9 K from the 1960s to 2016-2025 and say which kind of variation in energy flow is the better candidate for it. Part 3, feedback. Choose sea ice or the Missouri River. Using numbers from the reading, write a claim-evidence-reasoning paragraph showing how one change to Earth’s surface created changes in at least two other Earth systems, and say whether the loop reinforces or damps the first change.
Practice
Work these on paper or in your notebook, then open Check your answer. Aim for all of Fluency and Application; try at least one Challenge.
Printable version: this unit’s practice workbook (PDF)
Fluency
Build speed and accuracy with the core skill.
- What evidence shows that Earth’s outer core is liquid?
Check your answer
Answer: Shear (S) waves do not pass through it, and P waves slow sharply on entering it.Liquids cannot carry shear waves. - State the Stefan-Boltzmann law and the meaning of each symbol.
Check your answer
Answer: Power radiated per square meter = σT4, where T is absolute temperature (K) and σ = 5.670 × 10⁻⁸ W m−2 K−4.Doubling T multiplies the power by 16. - Is the ice-albedo feedback reinforcing (positive) or damping (negative)? Explain in one sentence.
Check your answer
Answer: Reinforcing: melting ice exposes dark ocean that absorbs more sunlight, which warms the water and melts more ice.Sea ice reflects 50-70%, ocean only 6%. - What is slab pull, and which half of the mantle convection cycle does it represent?
Check your answer
Answer: The sinking of cold, dense plate edges into the mantle at subduction zones, which USGS says most scientists favor as the main force driving plates; it is the sinking half of the convection cycle.Rising mantle rock at ridges is the other half.
Application
Use the skill in context. Show your reasoning.
- Find Earth’s balance temperature for S = 1,361 W/m2 and albedo 0.30, and compare it with 255.1 K for albedo 0.294.
Check your answer
Answer: About 254.6 K, 0.5 K cooler.T = [1,361 × 0.70 ÷ (4 × 5.670 × 10−8)]1/4 = 254.6 K. - Earth’s surface averages 288 K. How much power per square meter does it radiate, and how does that compare with the 240 W/m2 of sunlight Earth absorbs?
Check your answer
Answer: About 390 W/m2, about 150 W/m2 more than absorbed sunlight; the greenhouse effect returns that extra infrared to the surface.5.670 × 10−8 × 2884 = 390 W/m2. - One square meter of Arctic surface receives the same sunlight whether it is covered by sea ice (albedo 0.5) or open ocean (albedo 0.06). How many times more energy does the ocean absorb?
Check your answer
Answer: About 1.9 times.Absorbed fractions 0.94 and 0.50; 0.94 ÷ 0.50 = 1.88.
Challenge
Stretch problems. Expect to think before you write.
- Earth’s interior heat flow averages 0.087 W/m2 and absorbed sunlight 240 W/m2. Explain which one drives plate tectonics and which one controls climate, using the ratio.
Check your answer
Answer: Absorbed sunlight is about 2,800 times larger, so it controls surface temperature and climate. Interior heat is tiny at the surface but flows continuously from a huge hot interior, enough to keep the mantle convecting and the plates moving.240 ÷ 0.087 ≈ 2,770. - Before channelization a reach of the Missouri River was 1,200 ft wide; afterward 600 ft. Model a flood with the same discharge and the same speed in both channels. How must the depth change, and what does this predict about flood stages?
Check your answer
Answer: The depth must double, because Q = (width)(depth)(speed) stays the same while the width halves. The model predicts higher flood stages, which USGS researchers report on the lower Missouri River.Q = wdv, so d2/d1 = w1/w2 = 2 if v stays the same; in reality the speed rises too, so the depth rises somewhat less. - St. Louis warmed 3.5 °F (1.9 K) between the 1960s and 2016-2025. A 0.1% brighter Sun warms the model 0.06 K, and Milankovitch cycles act over tens of thousands of years. Which variation in energy flow best fits the St. Louis change, and what is one caution?
Check your answer
Answer: Rising greenhouse gases (carbon dioxide from about 280 to 421 ppm) fit best; solar change is about 30 times too small and orbital cycles far too slow. Caution: one city station also records urban warming.1.9 ÷ 0.06 ≈ 32.
Review
Keep earlier skills sharp.
- (Unit 2) Why does a dark roof get hotter in sunlight than a white one, and what is the Earth-scale version of the same idea?
Check your answer
Answer: The dark roof absorbs a larger fraction of the sunlight; on Earth’s scale, a lower albedo (less ice, more dark ocean) means more energy absorbed and a warmer balance temperature.Absorbed power = (1 − albedo) × incoming power. - (Unit 2) Thermal energy flows from hot to cold on its own. How does this drive mantle convection?
Check your answer
Answer: Heat flows from the hot core and deep mantle toward the cooler surface; heated rock becomes less dense and rises, cooled rock sinks, forming convection cells.The second law in motion.
Earth’s Energy and Feedbacks: Interior Evidence, the Radiation Balance, Sea Ice and the Missouri River
USGS The Interior of the Earth and This Dynamic Earth; KamLAND Collaboration, Nature Geoscience 2011; NASA Earth Fact Sheet; NASA Earth Observatory energy budget; NASA Science Milankovitch articles; NIST CODATA Stefan-Boltzmann constant; NSIDC sea ice and albedo; Missouri Conservationist (2001, 2013); USACE paper in the Seventh Federal Interagency Sedimentation Conference proceedings (USGS, 2001); Jacobson and Galat (USGS), Geomorphology 2006; NOAA NCEI Climate at a Glance, St. Louis; all retrieved November 5, 2026 · SLS original, citing U.S. and Missouri government sources and a cited journal abstract
Why this reading. The lesson builds three models: Earth’s convecting interior, Earth’s radiation balance, and feedbacks between Earth systems. This reading gives the evidence for each as the agencies publish it (retrieved November 5, 2026), two at-home demonstrations step by step, and every calculation worked. The energy-budget, Milankovitch and St. Louis figures are the same verified set used in RLP Physical Science B.
1. Evidence from inside (USGS; NASA Earth Fact Sheet)
- Earthquake waves: S (shear) waves do not travel through the core; the outer core is presumed liquid because it does not transmit S waves and P waves slow sharply in it. The inner core is solid.
- Going from mantle to core, earthquake-wave velocity decreases about 30% and density increases about 30%. Between 100 and 200 km down, rock is near its melting point and waves travel slightly slower; plates ride on this layer. The Moho, the crust-mantle boundary, shows a sharp increase in wave speed.
- Earth’s average density is twice that of surface rocks (Newton’s estimate, still essentially unchanged). NASA: mean density 5,513 kg/m3; moment of inertia factor 0.3308 (a uniform ball would be 0.4).
- Volumes (USGS): core 15%, mantle 84%, crust 1%. From NASA’s radii, (3,485 ÷ 6,371)3 = 16.4% for the core; the small difference comes from rounding and from where the boundary is drawn.
- Thicknesses (USGS): crust about 5 km under oceans, about 30 km under continents; mantle about 2,900 km; outer core about 2,200 km; inner core about 1,250 km. The deepest drill hole (Kola Peninsula) reaches 12 km.
2. Heat and convection
- KamLAND geoneutrino study, combining KamLAND (Japan) and Borexino (Italy) data (Nature Geoscience, 2011): the current total heat flux from Earth to space is 44.2 ± 1.0 TW (the study’s starting value); potassium-40 contributes 4 TW; radioactive decay supplies about half the total, so primordial heat has not been exhausted.
- Worked: Earth’s area 4π(6.371 × 10⁶ m)2 = 5.10 × 10¹⁴ m2; 44.2 × 10¹² W ÷ 5.10 × 10¹⁴ m2 = 0.087 W/m2. Absorbed sunlight (240.2 W/m2, below) is 2,770 times larger.
- USGS: the mantle behaves like thick soup heated to boiling: heated material rises, spreads, cools and sinks; mantle rock can soften and flow over millions of years; most scientists favor slab pull as the main force driving plates; plates move a few centimeters a year. USGS links the St. Francois Mountains’ 1.48-1.45-billion-year magmatism to mantle upwelling.
Demonstration A, stovetop (adult at the stove the whole time). Safety glasses on. Fill a light-colored pot two-thirds with water and sprinkle in a pinch of ground pepper. Heat on low with the burner under one side; handle turned inward; nobody leans over steam. Watch from the side for 5 minutes, before boiling: particles rise over the hot spot, drift across the top and sink on the cool side. Let the pot cool fully before moving it. Taste nothing. Demonstration B, no heat. Freeze water with three drops of food coloring in an ice-cube tray. Drop one colored cube into a clear glass of warm tap water and watch from the side for 3 minutes: cold, dense meltwater sinks in streamers, like a cold slab descending. Model limits. Water flows in seconds; mantle rock is solid and moves centimeters a year, heated from below and from within by radioactive decay.
3. The radiation balance (NASA; NIST)
- S = 1,361 W/m2; global average S/4 = 340.25 W/m2; Bond albedo 0.294; absorbed 340.25 × 0.706 = 240.2 W/m2 (NASA Earth Observatory: about 240).
- σ = 5.670374419 × 10⁻⁸ W m−2 K−4. T = [S(1 − A) ÷ 4σ]1/4 = 255.1 K (NASA lists a black-body temperature of 254.0 K). Actual average 288 K (15 °C); σ(288)4 = 390 W/m2. Greenhouse effect: about 33 K.
| Run | S (W/m2) | Albedo | T (K) | Change |
|---|---|---|---|---|
| Base | 1,361 | 0.294 | 255.1 | — |
| More ice | 1,361 | 0.31 | 253.7 | −1.5 K |
| Albedo 0.30 | 1,361 | 0.30 | 254.6 | −0.5 K |
| Less ice | 1,361 | 0.28 | 256.4 | +1.3 K |
| Sun 0.1% brighter | 1,362.4 | 0.294 | 255.2 | +0.06 K |
Spreadsheet tip: in a cell, =((B2*(1-C2))/(4*5.670374419E-8))^0.25.
4. Variations in energy flow (NASA)
- Eccentricity: about 100,000-year cycle; today about 6.8% more sunlight at perihelion (early January) than at aphelion (early July). Check with NASA’s distances: (152.100 ÷ 147.095)2 = 1.069.
- Obliquity: 22.1° to 24.5° over about 41,000 years; now 23.44°. Precession: about 23,000 years.
- Ice Ages came about every 41,000 years between one and three million years ago and about every 100,000 years since about 800,000 years ago. Today’s orbital positions alone predict slow cooling.
- Carbon dioxide rose from about 280 ppm to 421 ppm (2023); global average temperature rose more than 1 °C since 1850.
5. Feedback 1: sea ice and albedo (NSIDC)
Sea ice reflects 50 to 70% of solar energy; the surrounding ocean reflects only 6%. Absorbed fraction: ice 0.30 to 0.50, ocean 0.94; the ocean absorbs 0.94 ÷ 0.50 = 1.9 to 0.94 ÷ 0.30 = 3.1 times more. Melting ice → more absorbed sunlight → warmer water → more melting: a reinforcing feedback.
6. Feedback 2: the channelized Missouri River
- Missouri Conservationist (2013): beginning in 1912, Congress directed the Corps of Engineers to make the river easier and safer to navigate and to protect adjacent lands from flooding, which became the Bank Stabilization and Navigation Project; the channel is maintained 9 feet deep and 300 feet wide from Sioux City, Iowa, to the Mississippi River near St. Louis. Loss: 522,000 acres of water and land habitat, two-thirds in Missouri (about 348,000 acres). In 1986 Congress authorized the Missouri River Fish and Wildlife Mitigation Project to buy up to 166,750 acres of floodplain from willing sellers.
- Missouri Conservationist (2001): during the 1900s channelization shortened the river from Sioux City to St. Louis by 127 miles; about 552,000 acres (83%) of the channel and its erosion zone disappeared because of rock dikes and earthen levees; by the 1970s about 85% of the former floodplain was farmed intensively. (The 2001 and 2013 acreages measure slightly different things.)
- USACE (2001 sedimentation conference): the original channel, 1,200 feet to 2 miles wide, is now 600 to 1,100 feet wide; the narrowing cost over 100,000 acres of shallow open water.
- Jacobson and Galat (USGS, 2006): the project created “a narrow, swift, and deep channel from what was historically a shallow, shifting, braided river.” Downstream, floods reach higher stages than before river engineering; increased stages for larger discharges are attributed to constriction by revetments and levees; the lowest 400 km has incised modestly, lowering low-flow stages.
- Worked (a model, not a measurement): Q = w × d × v. Halve the width (1,200 ft → 600 ft) at the same discharge and speed, and the depth must double. If the speed also rises, the depth rises less.
7. St. Louis yearly average temperature (NOAA NCEI, station USW00013994)
| Period | Average (°F) |
|---|---|
| 1940s | 56.3 |
| 1950s | 56.6 |
| 1960s | 55.7 |
| 1970s | 55.7 |
| 1980s | 56.4 |
| 1990s | 57.7 |
| 2000s | 58.0 |
| 2010s (nine years; no value for 2013) | 58.6 |
| 2016-2025 | 59.2 |
1960s to 2016-2025: +3.5 °F = +1.9 K. 1940-1969 average 56.2 °F; 1996-2025 average 58.5 °F; difference 2.3 °F (1.3 K). Straight-line trend 1970-2025: about 0.72 °F per decade. Caution: one station measures one place, and a growing city adds warmth of its own.
Your turn
- Find the balance temperature for albedo 0.25 and for a Sun 1% dimmer.
- Compare the St. Louis 1.9 K rise with each row of the what-if table. Which kind of change could produce it?
- Draw a loop diagram (arrows with + or −) for the ice-albedo feedback, and a chain diagram for the Missouri River that reaches at least three Earth systems.
Sources: USGS, The Interior of the Earth (pubs.usgs.gov); USGS, This Dynamic Earth: Inside the Earth (pubs.usgs.gov); USGS, This Dynamic Earth: Understanding plate motions (pubs.usgs.gov); USGS, This Dynamic Earth: Some unanswered questions (pubs.usgs.gov); KamLAND Collaboration, Partial radiogenic heat model for Earth revealed by geoneutrino measurements, Nature Geoscience 4 (2011), abstract (nature.com); USGS Professional Paper 1866 (St. Francois Mountains) (usgs.gov); NASA NSSDC, Earth Fact Sheet (nssdc.gsfc.nasa.gov); NASA Earth Observatory, Climate and Earth’s Energy Budget (earthobservatory.nasa.gov); NIST CODATA, Stefan-Boltzmann constant (physics.nist.gov); NASA Science, Milankovitch (Orbital) Cycles and Their Role in Earth’s Climate (science.nasa.gov); NASA Science, Why Milankovitch (Orbital) Cycles Can’t Explain Earth’s Current Warming (science.nasa.gov); National Snow and Ice Data Center, Science of sea ice (nsidc.org); Missouri Conservationist, Vantage Point (October 2001) (mdc.mo.gov); Missouri Conservationist, Missouri River Restoration (June 2013) (mdc.mo.gov); Remus and Davinroy (USACE), Use of Chevron Structures to Create Depth Diversity in the Missouri River, Proceedings of the Seventh Federal Interagency Sedimentation Conference (2001) (pubs.usgs.gov); Jacobson and Galat (USGS), Flow and form in rehabilitation of large-river ecosystems: an example from the Lower Missouri River, Geomorphology 77 (2006) (cerc.usgs.gov); NOAA NCEI, Climate at a Glance: St. Louis, Missouri, annual average temperature (ncei.noaa.gov)