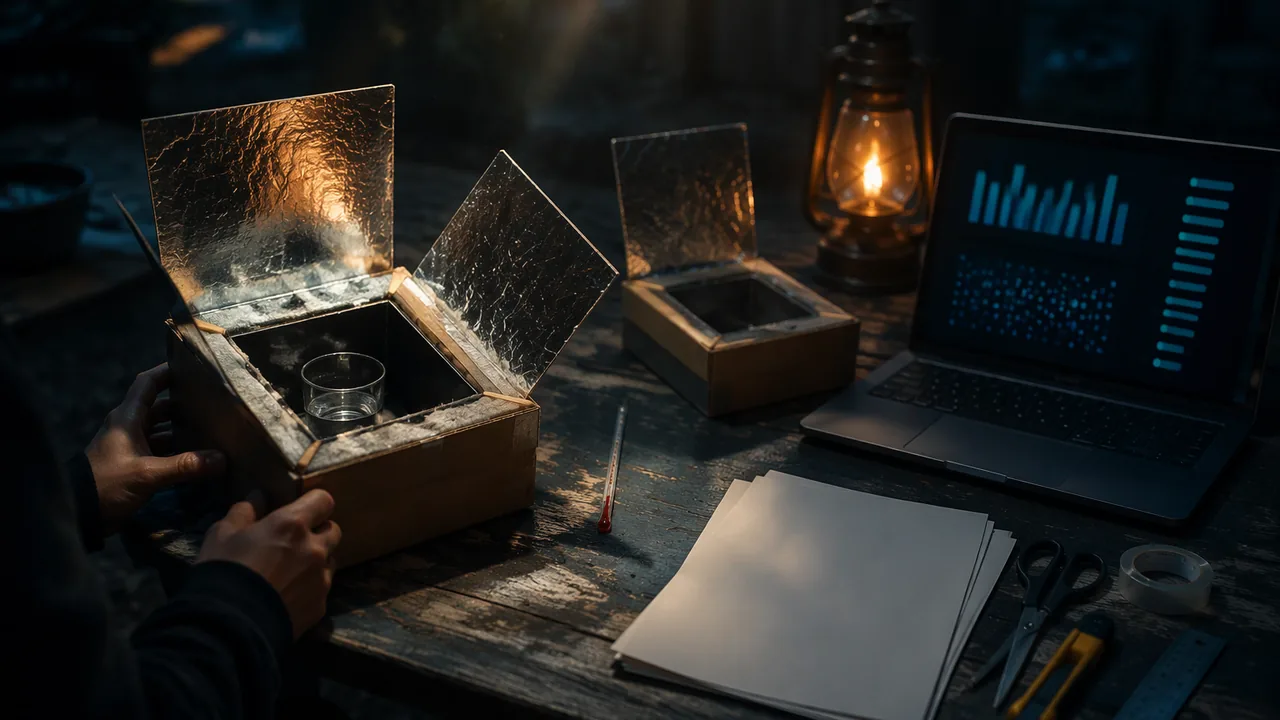
refine an energy-conversion device through tested iterations, use a spreadsheet model to predict the effect of changes, and evaluate the final design against prioritized criteria and constraints.
Instruction
The challenge. Take your solar oven from iteration 1 and make it better, then write the report an engineering team would write. (If a parent or guardian agrees, you may instead refine a different energy-conversion device built from household materials, such as a small wind turbine that lifts a load or a rubber-band-powered car, as long as input and output energy can be measured.)
1. Criteria and constraints (9-12.ETS1.A.1). Start by stating them precisely. Criteria are what success means, with numbers where possible: for example, a water temperature rise of at least 25 °C above the control in 30 minutes, or an efficiency of at least 15%. Constraints are the limits: materials, size, cost, safety, and one person able to carry it. Connect your device to a real need: in places without reliable electricity or clean fuel, solar cookers and water heaters can reduce smoke from burning wood indoors. Name one societal criterion (such as cost or ease of building from local materials) alongside the technical ones.
2. Model before you build (9-12.ETS1.B.2). Build a spreadsheet model of your oven. Inputs: opening area, reflector boost (a multiplier, for example 1.3 if the flap adds 30% more light), sunlight intensity, time, efficiency of absorption and fraction lost through the walls. Outputs: energy entering, energy reaching the water, predicted temperature rise (ΔT = Q ÷ (mc)). Use the model to compare at least two proposed changes (a second reflector, better insulation, a smaller container) before building either. Afterward, compare the prediction with your test: a model is useful if it predicts the right direction and roughly the right size of the change.
3. Refine and test (9-12.PS3.A.3). Build iteration 2 with the change your model favored and test it under the same conditions, with a control. Report temperatures, energy gained and efficiency for both iterations. Change one feature per iteration where possible, so you know what caused the difference.
4. Account for the energy (9-12.PS3.A.1). Draw the energy-flow diagram for the final design with numbers: energy in, energy to the water, and your estimate of each loss, adding to the total input. If they do not add up, say which loss you could not measure.
5. Evaluate (9-12.ETS1.B.1). Rank your criteria and constraints, score the final design, and state the trade-offs (a larger reflector collects more light but catches the wind; more insulation keeps heat but adds mass). Compare your results with the second oven’s record and with one published source on solar cookers, both in this lesson’s reading (RST.9-10.9), noting where findings agree and why they might differ.
Stages. Plan, draft the report, check it against the review checklist (with a parent, guardian or other adult reader if one is willing), revise, and record a presentation that ends with your answer to one question about your evidence.
📖 Read for this lesson
The reading opens over the lesson; close it to come back to exactly where you were. The checks below draw on it.
Formative check
Work through these before moving on. They are not graded — they tell you whether the standard below has landed yet.
A spreadsheet model predicts that a second reflector raises the water’s temperature rise from 18 °C to 24 °C, and the test gives 21 °C. What is the best conclusion?
‘The oven must be buildable for under a set cost from materials available locally’ is a societal constraint.
Draft your plan: state two criteria with numbers and two constraints, list your spreadsheet’s inputs and outputs, and name the two changes your model will compare.
How confident are you that you can refine an energy device with tests and a spreadsheet model and evaluate it against criteria and constraints?
Unit 3 checkpoint
Do this before you start the task. It covers the whole unit and tells you what to review first.
A 2.0 kg object at 4.0 m/s has kinetic energy
Gravitational potential energy is stored in
Lifting a 10 kg box 3.0 m stores J (g = 9.8 m/s2).
Mixing 100 g of water at 60 °C with 100 g at 20 °C, with no losses, gives
Thermal energy flows spontaneously from a colder object to a hotter one.
Warming 50 g of water by 10 °C takes J (c = 4.18 J/g·°C).
A bouncing ball rises lower each time because
A ball keeps 50% of its energy each bounce and is dropped from 80 cm. Its second rebound height is
A device takes in 5,000 J and delivers 1,500 J of useful energy. Its efficiency is
Improving a solar oven one sub-problem at a time (collect, absorb, keep) makes it possible to tell which change helped.
What is the main value of a spreadsheet model in the design process?
Which is a criterion rather than a constraint?
Submit: Energy Device Design Report (900-1,300 words) + four-minute recorded presentation
Task: Refine your energy-conversion device through at least two tested iterations. State criteria (including one societal criterion) and constraints; build a spreadsheet model and use it to compare proposed changes before building; report temperatures (or other measurements), energy and efficiency for each iteration; draw a numbered energy-flow diagram; and evaluate the final design against ranked criteria, comparing with the second oven’s record and a published source.
Submission workflow
- Stage 1 — Plan. Criteria and constraints, the spreadsheet model’s inputs and outputs, and the change you will test first.
- Stage 2 — Reviewed draft. After a day’s break, recheck your model’s formulas, your energy calculations and your fair-test design against the rubric; if a parent, guardian or other adult reader is willing, have them check it with you. Submit the review notes and your revision plan.
- Stage 3 — Final report. 900-1,300 words with data from both iterations, the model and its predictions, the energy-flow diagram and the evaluation.
- Stage 4 — Presentation and defense. Four minutes, recorded, with a demonstration of your device, ending with your answer to one question about your evidence.
How it is scored
| Criterion | What proficient looks like |
|---|---|
| Design and refinement (9-12.PS3.A.3) | Two tested iterations with controls; changes justified and results measured. |
| Criteria, constraints and evaluation (9-12.ETS1.A.1, 9-12.ETS1.B.1) | Quantitative criteria including a societal one; ranked evaluation with honest trade-offs. |
| Model (9-12.ETS1.B.2, 9-12.PS3.A.1) | Working spreadsheet model used to compare changes before building; prediction compared with results; energy accounted for. |
| Comparing sources (RST.9-10.9) | Results compared with the second oven’s record and a published source, with differences explained. |
| Communication (SEP.6, CCC.5) | Clear report, numbered energy-flow diagram and a presentation that answers questions with evidence. |
A Published Source on Solar Cookers, a Second Oven’s Record, and a Model That Predicts Before You Build
U.S. Department of Energy, EERE, Build a Pizza Box Solar Oven (content last updated 4/14/2006; archived printable version dated 8/26/13); NASA, Cooking with the Sun: Build a Solar Oven Design Challenge, 5E lesson plan (2024); the second-oven record and the spreadsheet model are SLS original and illustrative; retrieved November 5, 2026 · Public domain (works of the United States government)
Why this reading. The task requires three comparisons you cannot make from the lesson alone: with “one published source on solar cookers” (RST.9-10.9), with “the second oven’s record,” and between a spreadsheet model’s prediction and a test. This reading supplies the published source (two federal ones, quoted), a second oven’s complete record, and a worked model that predicts the effect of three changes before either is built. The second-oven record and the model are constructed teaching data and are labeled illustrative; the two federal sources are quoted as published.
1. Published source A: U.S. Department of Energy, “Build a Pizza Box Solar Oven”
From the Department of Energy’s children’s energy pages (content last updated April 14, 2006), as published:
“The sun is hot enough to bake food. Here’s how to make a simple solar oven that gets hot enough to warm up cookies and other treats, like s’mores. It won’t get really hot, though, so you can’t bake things in it and you won’t burn yourself when playing with it.”
“Wrap the underside (inside) face of this flap with aluminum foil. … The foil will help to reflect the sunlight into the box.” “Open the box and place a piece of black construction paper in so it fits the bottom of the box. This will help to absorb the sun’s heat.” “… tape down all four edges to form a seal. This creates a layer of air as insulation that helps keep the sun’s heat in the box.”
“Now open the flap and turn the box so the foil is facing the sun. The shadow of the flap should go straight back from the back of the box. … Wait about a half hour for the box to warm up in the sun.”
Notice that the DOE page names your three sub-problems in order, collect (foil flap), absorb (black paper), keep (sealed film as insulation), gives the same 30-minute warm-up your procedure uses, and gives an aiming rule you can test: the flap’s shadow “straight back” means the Sun is in the plane of the flap and the opening. It reports no temperatures and no efficiency. Its one performance claim is qualitative: warm, not bake.
2. Published source B: NASA, “Cooking with the Sun: Build a Solar Oven Design Challenge”
NASA’s 5E lesson plan (2024) sets a design constraint in numbers: “The only constraints on the design are the size of the box and that it must be capable of increasing the temperature by 5°C in 5 minutes.” Its materials list is “Cardboard box (no smaller than 40 cm wide) … Aluminum pie pans, Aluminum foil, Black construction paper, Plexiglass or plastic wrap to cover boxes,” and its improvement step tells students to try “more foil, larger window, more black paper, etc.” and to “Retest the new design.”
Set NASA’s criterion against the Lesson 3.4 record: that oven rose 4.6 °C in its first five minutes, just short of NASA’s 5 °C, and rose 20.1 °C over thirty. A source’s criterion can be compared with your data even when the source reports none of its own.
3. A second oven’s record (illustrative)
Same day, same sky and same 200 g of water as the Lesson 3.4 record, tested 1:00 to 1:30 p.m. Oven B, built by a second builder from the same materials list as its iteration 2: two foil flaps (lid flap plus a side flap), black paper on the floor and walls, two layers of film with a 1 cm air gap, all seams taped. Opening 0.090 m2.
| Time (min) | Oven water (°C) | Control water (°C) |
|---|---|---|
| 0 | 21.0 | 21.0 |
| 5 | 27.0 | 22.0 |
| 10 | 32.6 | 22.9 |
| 15 | 37.4 | 23.6 |
| 20 | 41.4 | 24.1 |
| 25 | 44.6 | 24.5 |
| 30 | 47.2 | 24.8 |
Energy gained by the water: 200 × 4.18 × (47.2 − 21.0) = 21,903 J. Light energy entering the 0.090 m2 opening in 1,800 s at 1,000 W/m2: 162,000 J. Efficiency: 13.5%. Effect above control: 26.2 − 3.8 = 22.4 °C. Against the Lesson 3.4 oven’s 10.4% and 16.1 °C, Oven B’s two changes together added about a third. Which change did the work? Oven B’s builder cannot say, because they changed two things at once; that is the point the task makes about one feature per iteration, and it is exactly what the model in section 4 is for.
4. The spreadsheet model, worked
Inputs: opening area A; reflector boost b (1.30 means the flap adds 30% more light); irradiance I = 1,000 W/m2; time t = 1,800 s; absorbed fraction a (light that becomes thermal energy inside rather than reflecting out); loss fraction L (the share of absorbed energy that leaks away before reaching the water). Energy in = A × b × I × t; energy to water = energy in × a × (1 − L); predicted rise = energy to water ÷ (m × 4.18). Row 1 is calibrated so that it reproduces the Lesson 3.4 record’s 20.1 °C rise (16,804 J measured; the model gives 16,795 J); the other rows change one input each.
| Case | A (m2) | b | a | L | Energy in (J) | Energy to water (J) | Predicted rise, 200 g (°C) |
|---|---|---|---|---|---|---|---|
| Iteration 1 as built (calibrated to the Lesson 3.4 record) | 0.090 | 1.30 | 0.55 | 0.855 | 210,600 | 16,795 | 20.1 |
| Change A: second reflector flap (boost 1.30 → 1.55) | 0.090 | 1.55 | 0.55 | 0.855 | 251,100 | 20,025 | 24.0 |
| Change B: double film + sealed seams (loss 0.855 → 0.82) | 0.090 | 1.30 | 0.55 | 0.820 | 210,600 | 20,849 | 24.9 |
| Change C: smaller sample, 100 g of water (same oven) | 0.090 | 1.30 | 0.55 | 0.855 | 210,600 | 16,795 | 20.1 |
Change C’s row shows the same energy to the water; its predicted rise for 100 g is double, 40.2 °C, because ΔT = Q ÷ (mc). It raises the temperature criterion without moving a single joule more into the box, which is why a report must state the water mass beside every temperature.
Reading the model against Oven B. The model predicts that a second reflector alone would lift the rise from 20.1 to 24.0 °C, and better sealing alone from 20.1 to 24.9 °C. Oven B’s builder did both and measured a rise of 26.2 °C. Applying both changes in the model at once (multiply the two gains) predicts about 29.7 °C, so the model overpredicts by about 3.5 °C. The lesson’s quiz describes this situation: predicted 24, measured 21, and the right conclusion is that the model got the direction and roughly the size right, and its inputs (probably the 1.55 boost, since a side flap catches less than the lid flap) should be refined from the test. A boost of about 1.37 would have matched.
5. Comparing sources and results (RST.9-10.9)
| Claim | DOE source | NASA source | Lesson 3.4 record | Oven B record |
|---|---|---|---|---|
| A box oven warms but does not bake | stated | implied (s’mores) | 40.6 °C water after 30 min: agrees | 47.2 °C: agrees |
| Foil flap collects, black absorbs, sealed film keeps | stated, no numbers | stated as design options | 10.4% efficiency with one of each | 13.5% with two flaps and double film |
| 5 °C in the first 5 minutes | not addressed | the criterion | 4.6 °C: just misses | 6.0 °C: meets |
| Efficiency | not addressed | not addressed | 10.4% | 13.5% |
Where the sources and the records agree, say so with the numbers. Where the sources are silent (efficiency, losses, the effect of sky), say that too: a published source that reports no data cannot be used to confirm or contradict a measurement, only a design principle. That distinction is the RST.9-10.9 skill.
Your turn
- Rebuild the model table in a spreadsheet, confirm the four predicted rises, and add a fifth row for a change of your own.
- Write the criteria and constraints for your device with numbers, including one societal criterion, and score the Lesson 3.4 oven and Oven B against them.
- Draw the numbered energy-flow diagram for Oven B: energy in, energy to water, and your best split of the remaining joules among reflection, warming the box and air, and leakage, adding to the total.
Sources: U.S. Department of Energy, EERE, Build a Pizza Box Solar Oven (archived printable page) (energy.gov); NASA, Cooking with the Sun: Build a Solar Oven Design Challenge (5E lesson plan) (nasa.gov)