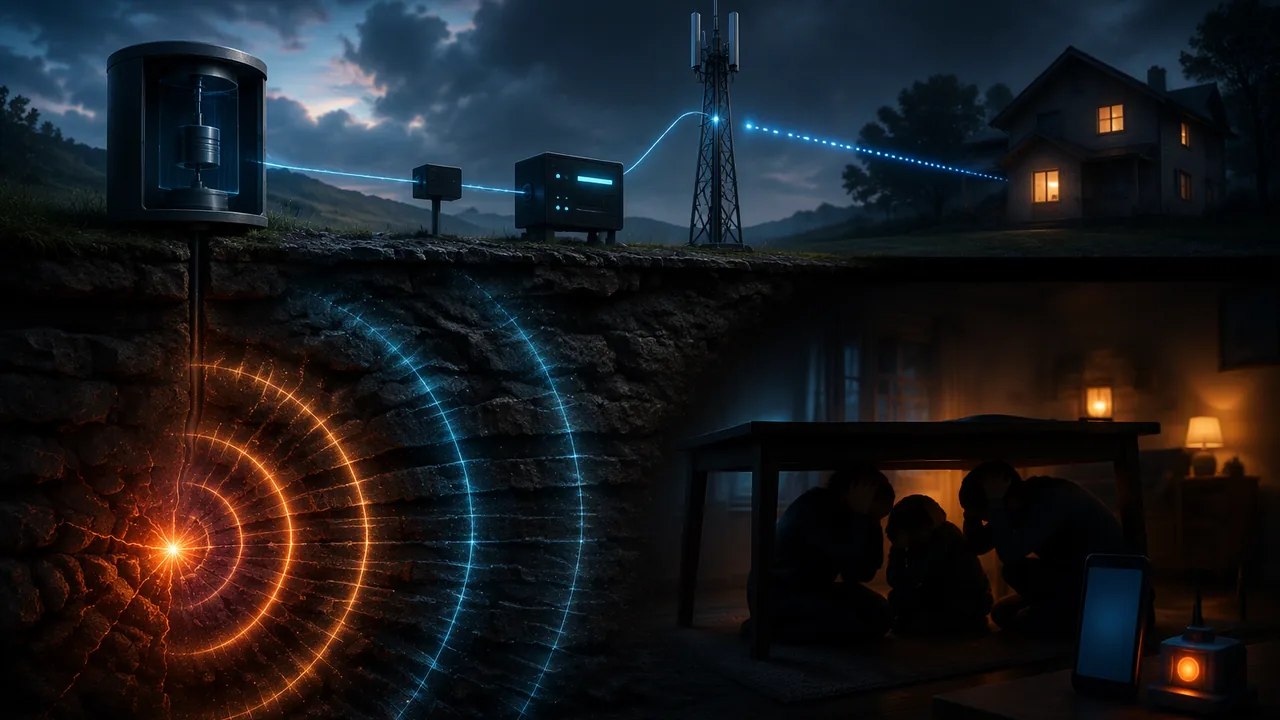
explain how an earthquake early-warning system such as the West Coast’s ShakeAlert detects seismic waves and delivers a digital warning, calculate warning times for Missouri locations with wave speeds, and evaluate digital transmission in the system.
Instruction
The audience. Missouri families hear about the New Madrid Seismic Zone and about the West Coast’s earthquake alerts, but rarely understand how an early-warning system works, what the warning time depends on, why places near the epicenter get little or none, or whether such a system could work here. Your explainer answers those questions accurately and calmly, the way a good USGS public page does, and ends with what to do when strong shaking or an alert arrives (drop, cover and hold on).
What the explainer must include.
- The wave physics (9-12.PS4.A.1). Explain P and S waves and why P waves arrive first. Calculate the warning time for at least two Missouri locations at different distances from an earthquake near New Madrid (for example, Sikeston about 33 km, Cape Girardeau about 80 km, St. Louis about 236 km), using typical speeds of about 6 km/s and 3.5 km/s and allowing a few seconds for detection and processing; state that the speeds are typical values. Use v = fλ at least once (for example, the wavelength of a seismic wave at a given frequency, or of the radio signal that carries the alert). Explain why places near the epicenter may get little or no warning.
- The system (9-12.PS4.B.1). Use ShakeAlert as your working example and say clearly that it serves the three U.S. West Coast states, not Missouri. Describe at least two devices in the chain and the wave behavior each depends on: the seismometer (a mass that lags behind while the ground moves), fiber-optic or radio links (light or radio waves carrying bits), and the phone’s or weather radio’s antenna and speaker.
- Digital transmission (enrichment). Explain why the alert would be sent digitally, through the channels Missouri already uses for tornado warnings (Wireless Emergency Alerts and NOAA Weather Radio’s SAME code), and evaluate at least two advantages (for example, noise resistance and broadcasting to millions of phones at once) and one limitation (for example, network delays, or phones and radios that are off or out of coverage).
- A diagram. One labeled diagram of the chain from earthquake to phone, with arrows showing where the information travels as seismic waves, electrical signals, light in fibers and radio waves.
Sources (RST.9-10.2). Use USGS Earthquake Hazards Program pages (the New Madrid summary and fact sheet, and the ShakeAlert fact sheet and news releases) and National Weather Service alert pages as your primary sources, and summarize their explanations accurately. Do not state numbers about alert thresholds, coverage, delivery times or when a warning system might come to Missouri unless you cite where they come from, and note the date you accessed them, because these systems are updated.
Care with the topic. Acknowledge the human impact of earthquakes in one or two sentences, avoid alarming language, and keep the focus on how warnings and preparation help people protect themselves.
Stages. Plan; draft; have a parent, guardian or other adult read the draft as a family audience would and mark anything unclear, while you check every number against its source with the checklist in Stage 2; revise; and record a four-minute presentation that answers one question from the list in Stage 4.
📖 Read for this lesson
The reading opens over the lesson; close it to come back to exactly where you were. The checks below draw on it.
Formative check
Work through these before moving on. They are not graded — they tell you whether the standard below has landed yet.
With P waves at 6.0 km/s and S waves at 3.5 km/s, about how much time separates their arrivals in St. Louis, about 236 km from an earthquake near New Madrid?
A seismometer works because a suspended mass tends to stay still while the ground and the instrument’s frame move around it.
Draft your plan: choose two Missouri locations and set up their warning-time calculations for an earthquake near New Madrid, list the devices you will explain and the wave behavior each uses, and name one advantage and one limitation of digital transmission.
How confident are you that you can explain how an early-warning system uses waves and digital signals, with calculations and evidence?
Unit 4 checkpoint
Do this before you start the task. It covers the whole unit and tells you what to review first.
A wave in water travels at 1.5 m/s with frequency 0.50 Hz. Its wavelength is
Why would an earthquake early-warning system give St. Louis more warning than Sikeston during an earthquake near New Madrid?
Increasing a wave’s amplitude increases its speed in the same medium.
At 90 km, with P at 6.0 km/s and S at 3.5 km/s, the P wave arrives after s.
Which observation is best explained by the particle (photon) model of light?
Scientists use both a wave model and a particle model for light because each explains evidence the other does not.
Ultraviolet light can damage DNA but radio waves cannot because
A claim is reliable if it appears on many websites, even if none cites evidence.
Why do digital signals resist noise better than analog signals?
With 16 bits per sample, a digital recording can represent different levels.
Optical fibers keep light inside because of
A solar cell produces current when absorbed photons give electrons in silicon enough energy to move.
Submit: Earthquake Early-Warning Technical Explainer (900-1,300 words) + four-minute recorded presentation
Task: Explain for Missouri families how an earthquake early-warning system works, using the West Coast’s ShakeAlert system as your example, and what such a system could and could not do for an earthquake near New Madrid. Calculate warning times for at least two Missouri locations with P- and S-wave speeds and use v = fλ at least once; describe at least two devices in the chain and the wave behavior each uses; evaluate the advantages and a limitation of digital transmission through Wireless Emergency Alerts or NOAA Weather Radio; include one labeled diagram; and cite USGS and National Weather Service sources with access dates.
Submission workflow
- Stage 1 — Plan. Outline, the two or more Missouri locations you will calculate, the devices you will describe and your sources.
- Stage 2 — Reviewed draft. A parent, guardian or other adult reads the draft as a family member would and marks anything unclear. You check every number against its source using this list: each figure has a named source and access date; each calculation shows distance ÷ speed; the explainer says ShakeAlert is a West Coast system. Submit the marked draft or their notes and your revision plan.
- Stage 3 — Final explainer. 900-1,300 words with the diagram, calculations and citations.
- Stage 4 — Presentation and defense. Record a four-minute presentation, then answer one of these questions on the recording: Why would Sikeston get much less warning than St. Louis? Why can a digital alert be relayed without getting noisier? What would Missouri need before it could have earthquake early warning?
How it is scored
| Criterion | What proficient looks like |
|---|---|
| Devices and wave behavior (9-12.PS4.B.1) | Accurately explains at least two devices and the wave interactions they rely on. |
| Wave calculations (9-12.PS4.A.1) | Correct warning-time calculations with stated assumptions and a correct use of v = fλ. |
| Digital transmission (enrichment) | Evaluates advantages and a limitation with sound reasoning. |
| Sources (RST.9-10.2, SEP.8) | Summarizes USGS sources accurately; no unsourced figures. |
| Communication (CCC.6) | Clear, calm and accurate for a public audience; diagram shows the information chain. |
How Much Warning Could Missouri Get? USGS Wave Speeds and Warning Times for an Earthquake near New Madrid
USGS, Seismographs: Keeping Track of Earthquakes; USGS Fact Sheet 2014-3083, version 1.2 (February 2017); USGS Summary of 1811-1812 New Madrid Earthquakes Sequence; USGS Fact Sheet 2009-3071; U.S. Census Bureau 2024 Gazetteer place file (internal-point coordinates, great-circle distances computed by SLS); NWS NOAA Weather Radio frequencies; retrieved November 5, 2026. Warning times use the unit’s typical speeds (6.0 and 3.5 km/s) and an illustrative 5 s alert time · Public domain (works of the United States government), with SLS computations
Why this reading. The unit’s warning times rest on two speeds it calls “typical values”: 6.0 km/s for P waves and 3.5 km/s for S waves. This reading shows what USGS says about those speeds, gives real straight-line distances from the town of New Madrid to Missouri cities, and works every warning time for an earthquake centered near New Madrid in one table, so you can check your own and pick the places for your explainer.
1. How fast the waves travel, as USGS states it
USGS’s seismograph explainer: the P wave “travels at a speed usually less than 6 kilometers per second in the Earth’s crust and jumps to 13 kilometers per second through the core,” while the S wave “shakes the rock sideways as it advances at barely more than half the P-wave speed.” The ShakeAlert fact sheet (USGS FS 2014–3083) gives the range for shaking waves near the surface: “0.5 to 3 miles per second,” which is 0.8 to 4.8 km/s.
The unit’s 6.0 km/s for P waves sits at the top of USGS’s “usually less than 6” for crust, and 3.5 km/s is 58% of it, USGS’s “barely more than half.” So the unit’s values are the fast end of typical. Much of the Missouri Bootheel sits on thick, soft river sediment; there both waves are slower near the surface, and the arrival times in the table below would all be somewhat later.
2. Distances
Straight-line (great-circle) distances from the town of New Madrid to each city, computed from the internal-point latitude and longitude of each place in the U.S. Census Bureau’s 2024 Gazetteer files, rounded to the nearest kilometer. A real earthquake would not start exactly under the town: the 1811–1812 shocks were in northeast Arkansas, in Missouri, and on the Reelfoot fault in Missouri and Tennessee, three different places. Treat these as a model earthquake “near New Madrid,” like the January 23, 1812, shock.
3. Every warning time, worked
P-wave arrival = distance ÷ 6.0 km/s; S-wave arrival = distance ÷ 3.5 km/s. The model assumes sensors near the epicenter catch the P wave and an alert goes out 5 s after the earthquake begins, then reaches phones and radios almost instantly. The 5 s is a round, illustrative allowance; the real delay depends on the sensor network and the processing, and no Missouri figure exists because no public earthquake early-warning system operates here. Warning = S-wave arrival − 5 s.
| Place | Distance from New Madrid (km) | P wave arrives (s) | S wave arrives (s) | S minus P (s) | Warning before the S wave, alert out at 5 s (s) |
|---|---|---|---|---|---|
| A site 10 km away | 10 | 1.7 | 2.9 | 1.2 | none |
| A site 15 km away | 15 | 2.5 | 4.3 | 1.8 | none |
| A site 20 km away | 20 | 3.3 | 5.7 | 2.4 | 0.7 |
| A site 30 km away | 30 | 5.0 | 8.6 | 3.6 | 3.6 |
| Sikeston, Mo. | 33 | 5.5 | 9.4 | 3.9 | 4.4 |
| Poplar Bluff, Mo. | 79 | 13.2 | 22.6 | 9.4 | 17.6 |
| Cape Girardeau, Mo. | 80 | 13.3 | 22.9 | 9.5 | 17.9 |
| Memphis, Tenn. | 169 | 28.2 | 48.3 | 20.1 | 43.3 |
| St. Louis, Mo. | 236 | 39.3 | 67.4 | 28.1 | 62.4 |
| Springfield, Mo. | 340 | 56.7 | 97.1 | 40.5 | 92.1 |
| Columbia, Mo. | 358 | 59.7 | 102.3 | 42.6 | 97.3 |
| Kansas City, Mo. | 522 | 87.0 | 149.1 | 62.1 | 144.1 |
Reading the table. At 10, 15 or 20 km the S wave arrives within about 5.7 s, so an alert issued at 5 s would give at most a fraction of a second (20 km) or nothing; this is the late-alert zone. Sikeston, about 33 km away, gets about 4.4 s; Cape Girardeau about 17.9 s; St. Louis about 62.4 s; Kansas City more than two minutes. The S-minus-P gap grows in proportion to distance: gap = distance × (1/3.5 − 1/6.0) = distance × 0.119 s per km. Turn it around and every second of gap means about 8.4 km of distance.
Far is not the same as safe. USGS records chimneys toppled in St. Louis in 1811–1812, and its 2009 fact sheet names St. Louis among the communities at risk of severe shaking. Seismic waves in the central United States travel a long way before they weaken: USGS estimates the area of damaging shaking from the 1811–1812 shocks at 600,000 km². St. Louis would have the most warning of any city near the zone’s damage area, and still need every second of it.
4. The wave equation, checked
The tuning A: v = fλ gives λ = 343 ÷ 440 = 0.78 m. The quiz: 5.0 Hz × 2.0 m = 10 m/s. A seismic S wave at 3.5 km/s with a frequency of 1 Hz has a wavelength of 3,500 m, which is why a whole neighborhood moves together. A NOAA Weather Radio broadcast at 162.475 MHz, one of the service’s seven frequencies, travels at 3.00 × 10⁸ m/s and has λ = 3.00 × 10⁸ ÷ 1.62475 × 108 = 1.85 m. In the simulation’s water tank the medium fixes the speed and the paddle fixes the frequency, so doubling the frequency halves the wavelength: at 0.30 m/s, 0.5 Hz gives 0.60 m and 1.0 Hz gives 0.30 m.
Your turn
- Add rows for Jefferson City (319 km) and Joplin (444 km) and state the warning time at each with the alert out at 5 s.
- Using USGS’s slower range instead of the unit’s values, recompute the S-minus-P gap at Cape Girardeau (80 km) for a soft-sediment case (P 4.8 km/s, S 2.8 km/s). Does soft ground give more or less time between the two arrivals at the same distance, and why?
- Choose the two Missouri places for your explainer: one that would get a useful warning and one in or near the late-alert zone. Write one sentence for each saying what a person there could do with that much time.
Sources: USGS, Seismographs: Keeping Track of Earthquakes (usgs.gov); USGS Fact Sheet 2014-3083, ShakeAlert: An Earthquake Early Warning System for the United States West Coast (pubs.usgs.gov); USGS, Summary of 1811-1812 New Madrid Earthquakes Sequence (usgs.gov); USGS Fact Sheet 2009-3071, Earthquake Hazard in the New Madrid Seismic Zone Remains a Concern (pubs.usgs.gov); U.S. Census Bureau, 2024 Gazetteer Files (place and county files) (www2.census.gov); National Weather Service, NOAA Weather Radio All Hazards (frequencies) (weather.gov)