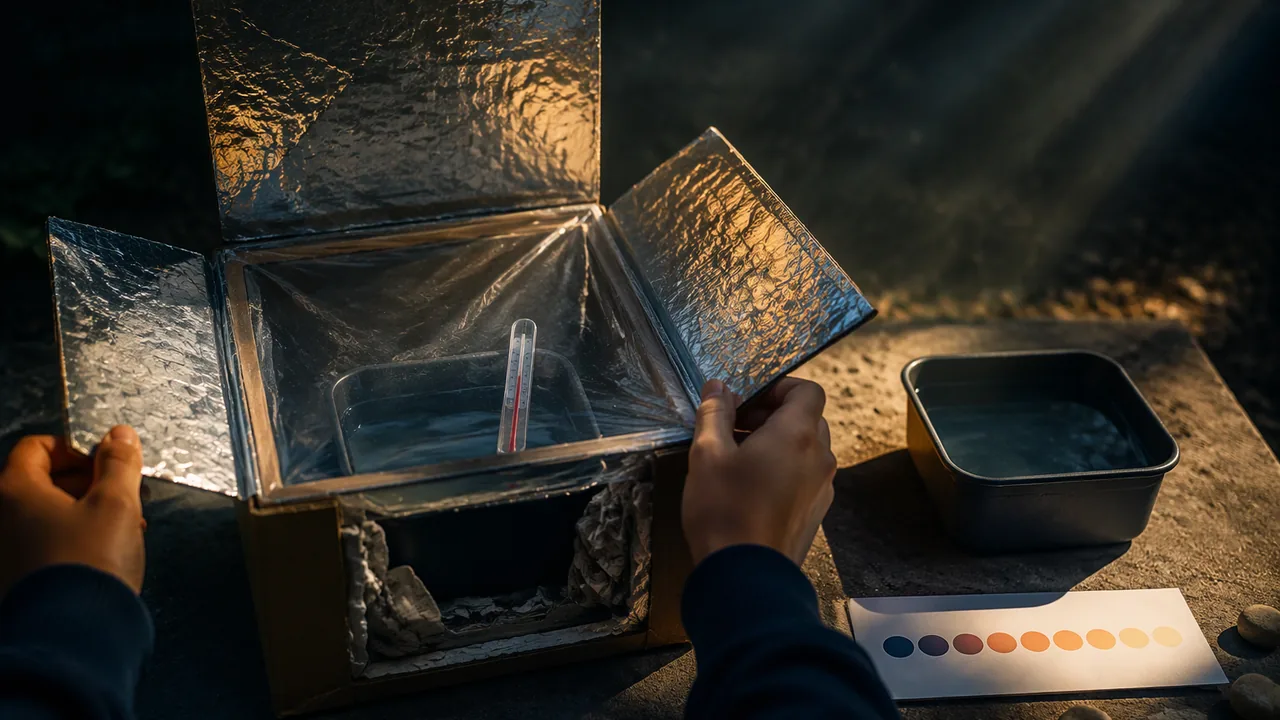
build a solar oven that converts light energy into thermal energy, measure its temperature rise, estimate its efficiency, and break the design problem into parts that can be improved separately.
Instruction
The design problem. Sunlight carries energy. On a clear Missouri day near midday in spring or summer, sunlight delivers roughly 1,000 watts on every square meter facing the sun (a widely used round figure; it is less in the morning, in winter and through haze or smoke). Season matters: NASA’s 25-year record for Columbia, Missouri, puts the average June day at about 6.5 kWh of sunlight on each square meter of flat ground and the average December day at about 1.9 kWh. A solar oven is a device that converts that light into thermal energy and keeps it, so food or water gets hot. 9-12.PS3.A.3 asks you to design, build and refine a device that converts one form of energy into another within constraints.
How a box oven works: three sub-problems (9-12.ETS1.A.2). Break the design into parts, each with its own physics:
- Collect. Foil-covered flaps reflect extra sunlight into the box, increasing the light energy entering. A bigger opening or better-angled reflectors collect more.
- Absorb. Black surfaces absorb most visible light and turn it into thermal energy; white or shiny surfaces reflect it. A black paper floor and a dark pot convert more light.
- Keep. A clear plastic-film window lets light in but slows the escape of warm air, and newspaper insulation around the walls slows conduction. Every gap lets warm air out.
Because the sub-problems are separate, you can test one change at a time: add a reflector, keep everything else the same, and measure the difference.
Measuring performance. Put 200 g of water in a dark container inside the oven, with a thermometer. Record the water temperature every 5 minutes for 30 minutes, and do the same for an identical container of water sitting in the sun outside the oven, as a control. The difference between the two temperature rises is the oven’s effect.
Estimating efficiency. Efficiency = useful energy out ÷ energy in × 100%. Worked example with illustrative numbers: the opening is 0.30 m × 0.30 m = 0.090 m2, so at 1,000 W/m2 the light power entering is about 90 W (ignoring the reflectors). In 30 minutes (1,800 s) that is 90 × 1,800 = 162,000 J. The 200 g of water warms from 20 °C to 40 °C: Q = 200 × 4.18 × 20 = 16,720 J. Efficiency = 16,720 ÷ 162,000 ≈ 10%. The rest of the energy warmed the box and the air, was reflected away, or leaked out. A 10% oven is a respectable first iteration; the design challenge is to raise it.
Energy model. Draw the energy flow: light from the Sun → (reflect, pass through the window) → absorbed by dark surfaces → thermal energy of air, container and water → some lost through walls, gaps and window. Label where each design feature acts. This diagram guides your refinements: attack the largest loss first.
Constraints. The build constraints are: one pizza box (or similar cardboard box), at most 1 m2 of foil, one sheet of clear plastic film, black paper, tape and newspaper; no mirrors of glass; the oven must be carried by one person. Criteria: highest water temperature rise in 30 minutes, and highest efficiency.
Safety. Solar ovens can reach temperatures that burn skin; handle the container with an oven mitt. Never look at the sun or at reflected sunlight from the foil. Wear sunscreen and a hat outside, and stay in the shade between readings. Have an adult help with any cutting.
📖 Read for this lesson
The reading opens over the lesson; close it to come back to exactly where you were. The checks below draw on it.
Lab: Build and Test a Solar Oven (Iteration 1)
Question. How much of the sunlight entering a box solar oven can it convert into thermal energy in 200 g of water in 30 minutes?
Materials
- A pizza box or similar cardboard box, aluminum foil, clear plastic wrap or a clear sheet protector, black construction paper, newspaper, tape and a ruler
- Two identical small dark containers (such as painted cans or dark plastic cups) with 200 g of water each
- Two kitchen thermometers (or one, read in the oven and then the control at each time), a phone or kitchen timer, and an oven mitt
- Hat, sunscreen and a shaded spot for waiting between readings
- Never look directly at the sun or at sunlight reflected from the foil; angle reflectors while looking at the shadow, not the glare.
- The oven’s inside and container can get hot enough to burn; use the oven mitt to handle them.
- Wear a hat and sunscreen; wait in the shade between readings and drink water. No flames or electric heaters are used.
Procedure
- Cut a flap in the lid, cover its inner side with foil, and prop it at an angle to reflect sunlight into the box. Line the box floor with black paper and insulate the walls with rolled newspaper.
- Tape clear plastic film tightly over the opening under the flap to make a window; seal the gaps with tape.
- Measure the opening’s length and width and calculate its area in square meters.
- Place one container of water (200 g) with a thermometer in the oven, and the other container in full sun beside it as a control. Record both starting temperatures.
- Aim the oven at the sun and record both temperatures every 5 minutes for 30 minutes, re-aiming the oven as the sun moves.
- Calculate the energy gained by the water in the oven, the light energy entering the opening (area × 1,000 W/m2 × 1,800 s), and the efficiency.
Data
| Time (min) | 0 | 5 | 10 | 15 | 20 | 25 | 30 |
|---|---|---|---|---|---|---|---|
| Oven water (°C) | |||||||
| Control water (°C) |
Opening area: ____ m2. Energy gained by oven water: ____ J. Light energy in: ____ J. Efficiency: ____ %. Sky conditions: ________
Analysis
- Claim: how well does your oven convert light energy into thermal energy? Evidence: temperature rise compared with the control, and your efficiency. Reasoning: explain the energy flow with your diagram.
- Identify the largest energy loss in your design and propose one change that targets it.
- The 1,000 W/m2 figure is a round estimate. Explain how haze, smoke, time of day or season would change your efficiency calculation.
- Which sub-problem (collect, absorb, keep) will you improve first in iteration 2, and how will you test that one change fairly?
If you cannot do this lab in person: If there is no usable sun, use a desk lamp with a 60 W incandescent or halogen bulb 30 cm above the opening as the light source (an adult checks the setup first; the bulb gets hot), or analyze the provided data set in this lesson’s reading and complete the same calculations.
Formative check
Work through these before moving on. They are not graded — they tell you whether the standard below has landed yet.
An oven’s opening is 0.25 m2 and sunlight delivers 1,000 W/m2. How much light energy enters in 10 minutes?
A black floor helps a solar oven because black surfaces absorb more light and turn it into thermal energy.
Warming 200 g of water by 15 °C takes J (c = 4.18 J/g·°C).
List the three sub-problems of your solar oven (collect, absorb, keep), the design feature addressing each, and the one change you will test in iteration 2 with a fair-test plan.
How confident are you that you can build and test an energy-conversion device, estimate its efficiency and plan improvements?
Practice
Work these on paper or in your notebook, then open Check your answer. Aim for all of Fluency and Application; try at least one Challenge.
Printable version: this unit’s practice workbook (PDF)
Fluency
Build speed and accuracy with the core skill.
- A motor does 3000 J of work in 30 s. What is its power output?
Check your answer
Answer: 100.0 WP = W/t. - A motor does 12000 J of work in 5 s. What is its power output?
Check your answer
Answer: 2,400.0 WP = W/t. - An oven opening is 0.40 m by 0.30 m. What is its area in m2?
Check your answer
Answer: 0.12 m2 - At 1,000 W/m2, how much light power enters a 0.12 m2 opening?
Check your answer
Answer: 120 W - Name the solar oven design feature that addresses each sub-problem: collecting light, absorbing it, keeping the thermal energy.
Check your answer
Answer: Foil reflectors; black paper and dark container; clear window, insulation and sealed gaps - Why does the solar oven test include a container of water in the sun outside the oven?
Check your answer
Answer: It is the control: it shows how much the water would warm without the oven, so the difference is the oven’s effect.
Application
Use the skill in context. Show your reasoning.
- An oven with a 0.12 m2 opening warms 250 g of water from 22 °C to 47 °C in 20 minutes at about 1,000 W/m2. Find the energy entering, the energy gained by the water and the efficiency.
Check your answer
Answer: 144,000 J in; 26,125 J to the water; about 18%0.12 × 1,000 × 1,200 s = 144,000 J. 250 × 4.18 × 25 = 26,125 J. 26,125 ÷ 144,000 = 0.181. - Oven A’s water rose 22 °C and its control rose 6 °C; Oven B’s water rose 25 °C with a control rise of 12 °C on a hotter afternoon. Which oven performed better, and why must you use the controls to decide?
Check your answer
Answer: Oven A: it added 16 °C beyond its control, against Oven B’s 13 °C. Conditions differed, so the raw rises are not comparable; the control removes the effect of weather.22 − 6 = 16; 25 − 12 = 13. - Haze or smoke cuts the sunlight reaching an oven roughly in half on some days (illustrative). If you still use 1,000 W/m2 in your calculation, will your efficiency estimate be too high or too low? Explain.
Check your answer
Answer: Too low. The real energy input was about half the assumed value, so dividing the water’s energy gain by the larger assumed input underestimates the true efficiency.Efficiency = output ÷ input; overstating the input shrinks the ratio.
Challenge
Stretch problems. Expect to think before you write.
- Adding a second foil reflector is expected to increase the light entering by 30%, but it also casts wind on the oven and cools it. Describe a fair test to find out whether the net effect is positive, and what data would show it.
Check your answer
Answer: Build two identical ovens (or test one oven on two identical days at the same time), one with and one without the second reflector, each with its own control container. Measure the temperature rise above the control over 30 minutes; if the two-reflector oven’s rise above control is larger, the net effect is positive.Change one variable; keep time, water mass, container and sky conditions the same.
Review
Keep earlier skills sharp.
- Find the kinetic energy of a 1000 kg object moving at 8 m/s.
Check your answer
Answer: 32,000 JKE = ½mv2. - A generator’s coil is harder to turn when a lamp is connected. Why?
Check your answer
Answer: The induced current’s magnetic field pushes back against the rotation, so more work is needed; that work becomes the lamp’s energy.
The Sunny-Day Backyard Record: An Oven and Its Control, Minute by Minute, and Where the 1,000 Watts Come From
One recorded 30-minute test of a first-iteration pizza-box oven with a control container in a Columbia, Missouri, backyard, following the Lesson 3.4 procedure, constructed for this course and illustrative; NASA Scientific Visualization Studio, Solar Variability and Total Solar Irradiance, and NASA Science, Four decades and counting, for the 1,361 W/m<sup>2</sup> figure; PVEducation, Standard Solar Spectra, for the 1,000 W/m<sup>2</sup> integrated ASTM G-173 AM1.5 global spectrum; NASA POWER Climatology API (v2.10.1, January 2001 to December 2025), all-sky and clear-sky surface shortwave downward irradiance at 38.95° N, 92.33° W; retrieved November 5, 2026 · SLS original (constructed teaching data), with public-domain NASA reference figures and a published standard value
Why this reading. The lab’s alternative route names “the provided data set in this lesson’s reading.” Here it is, with the control container beside the oven, so that on a cloudy day, or with no sunny spot at home, the efficiency can still be computed and the design breakdown still argued. It is constructed teaching data and is labeled illustrative. The second half of the reading is about the one number the whole calculation rests on, 1,000 watts per square meter: where it comes from, why the lesson calls it a round estimate, and how much sunshine Missouri actually gets in each month.
Procedure that produced the record
Pizza box, 30 cm × 30 cm opening (0.090 m2) under a single foil flap propped at about 60°; black paper floor; one layer of plastic film; rolled newspaper along the walls. A 200 g sample of water in a black-painted steel can with a thermometer through the lid, inside the oven; an identical can, water and thermometer in full sun 1 m away as the control. Test run in a backyard in Columbia, Missouri, at 12:10 to 12:40 p.m. in late April, clear sky, light breeze, air temperature 22 °C; the oven re-aimed at each reading. n = 7 paired readings.
Table 1. Water temperature against time
| Time (min) | Oven water (°C) | Control water (°C) |
|---|---|---|
| 0 | 20.5 | 20.5 |
| 5 | 25.1 | 21.6 |
| 10 | 29.4 | 22.5 |
| 15 | 33.0 | 23.2 |
| 20 | 36.0 | 23.8 |
| 25 | 38.5 | 24.2 |
| 30 | 40.6 | 24.5 |
Opening area: 0.090 m2. Sky: clear. Assumed irradiance: 1,000 W/m2.
Table 2. Computed from the record
| Quantity | Computation | Result |
|---|---|---|
| Light power entering the opening | 0.090 m2 × 1,000 W/m2 | 90 W |
| Light energy entering in 30 minutes | 90 W × 1,800 s | 162,000 J |
| Energy gained by the oven’s water | 200 g × 4.18 J/(g·°C) × (40.6 − 20.5) °C | 16,804 J |
| Energy gained by the control’s water | 200 × 4.18 × (24.5 − 20.5) | 3,344 J |
| Efficiency, water energy ÷ light energy in | 16,804 ÷ 162,000 | 10.4% |
| Oven’s effect above the control | (40.6 − 20.5) − (24.5 − 20.5) | 16.1 °C |
The record reproduces the mini-lecture’s worked example: a 20-degree rise in 200 g of water is 16,720 J against 162,000 J entering, about 10%. The lesson’s quiz is the same first step at a different size: 0.25 m2 × 1,000 W/m2 = 250 W, times 600 s = 150,000 J. Its fill-in is the same second step: 200 × 4.18 × 15 = 12,540 J.
Reading the record
The curve bends. The oven’s water rose 4.6 °C in the first five minutes and 2.1 °C in the last five. Energy was arriving at the same rate all along; what changed is that the warmer the box, the faster it loses energy to the air through the film, the walls and every gap. Eventually gain equals loss and the temperature levels off. A better-insulated oven bends later and levels higher. That bend is the “keep” sub-problem made visible.
The control matters. The control can warmed 4.0 °C on its own, sitting in the sun. If you credited the oven with the whole 20.1-degree rise you would overstate its effect by about a fifth. The oven’s effect is 16.1 °C above the control, and that is the number to compare between iterations tested under the same sky.
Where the other 90% went. About 162,000 J entered; 16,804 J ended in the water. The rest reflected off the film and the can, warmed the black paper, the cardboard and the air in the box, and leaked out through the film, the walls and the gaps as the box grew warmer than the outside air. The analysis asks you to name the largest loss and attack it first. In this design the largest single loss is almost certainly through the single layer of film and the unsealed corners, because that is where the warm air escapes; a second layer of film with an air gap, and tape on every seam, is the change the energy model points to.
Where 1,000 W/m2 comes from
Above the atmosphere, facing the Sun, sunlight carries about 1,361 watts per square meter; NASA calls this the total solar irradiance and has measured it from satellites for four decades. The atmosphere scatters and absorbs part of it. The reference value engineers use for a clear sky with the Sun fairly high, the standard spectrum ASTM G-173 (“air mass 1.5”), integrates to 1,000 W/m2 on a surface tilted toward the Sun. That is the round figure in the lesson, and it is a standard condition, not a measurement of your afternoon.
| Condition | Effect on the power reaching your opening | Effect on a computed efficiency that assumes 1,000 W/m2 |
|---|---|---|
| Midday, clear, oven aimed at the Sun | near the 1,000 W/m2 standard | close to correct |
| Sun low in the sky (morning, late afternoon, winter) | less: light crosses more air and arrives at a slant | too low: you divide by more energy than really arrived |
| Haze or smoke | less, and more of it scattered rather than direct, so the flap reflects less | too low, often by a large factor |
| Oven not re-aimed as the Sun moves | less enters the opening; the reflector misses | too low, and the error grows through the test |
Every entry in the last column says “too low.” Under a hazy or smoky sky the same oven might warm its water 8 °C instead of 20 and be computed at 4% efficiency when the oven itself is unchanged; the input was smaller, not the device worse. This is the answer to the third analysis question, and it is why your report must record the sky and the time, and why two iterations must be compared on the same day or against the same control.
How much sunshine does Missouri get?
NASA’s POWER project publishes a 25-year climatology (January 2001 to December 2025) of the solar energy reaching flat ground at any point on Earth. For Columbia, Missouri (38.95° N, 92.33° W), the average daily totals are:
| Month | All skies, as they really were (kWh per m2 per day) | Clear skies only (kWh per m2 per day) | All-sky as a share of clear-sky |
|---|---|---|---|
| January | 2.17 | 3.20 | 68% |
| April | 5.01 | 7.03 | 71% |
| June | 6.54 | 8.06 | 81% |
| December | 1.91 | 2.82 | 68% |
| Whole-year average | 4.24 | 5.62 | 75% |
Two lessons for your oven. First, season matters more than design: an average June day in Columbia delivers 6.54 ÷ 1.91 = 3.4 times the sunlight of an average December day, so an oven tested in December will look much worse even if it is identical. Second, clouds matter: across the year, real skies deliver about three-quarters of the clear-sky energy. A June day’s 6.54 kWh per square meter is the same as 6.5 hours of the 1,000 W/m2 standard, so the standard is a fair description of the few clear hours around noon, not of a whole day. Test near midday, on a clear day, in spring or summer, and record the date with your data.
Your turn
- Graph both temperature series on one set of axes and mark where the oven curve’s slope has fallen to half its starting value.
- Recompute the efficiency assuming the real irradiance was 700 W/m2 because of haze. State in one sentence what changed and what did not.
- Fill in the design breakdown the lesson asks for (collect, absorb, keep) using this oven’s features, name the one change you would test in iteration 2, and describe how you would run a fair test against Table 1.
Sources: NASA Scientific Visualization Studio, Solar Variability and Total Solar Irradiance (TSI) (svs.gsfc.nasa.gov); NASA, Four decades and counting: new NASA instrument continues measuring solar energy input to Earth (science.nasa.gov); PVEducation, Standard Solar Spectra (ASTM G-173-03 AM1.5 Global, 1000 W/m2) (pveducation.org); NASA POWER Climatology API, Columbia, Missouri (ALLSKY_SFC_SW_DWN and CLRSKY_SFC_SW_DWN) (power.larc.nasa.gov)