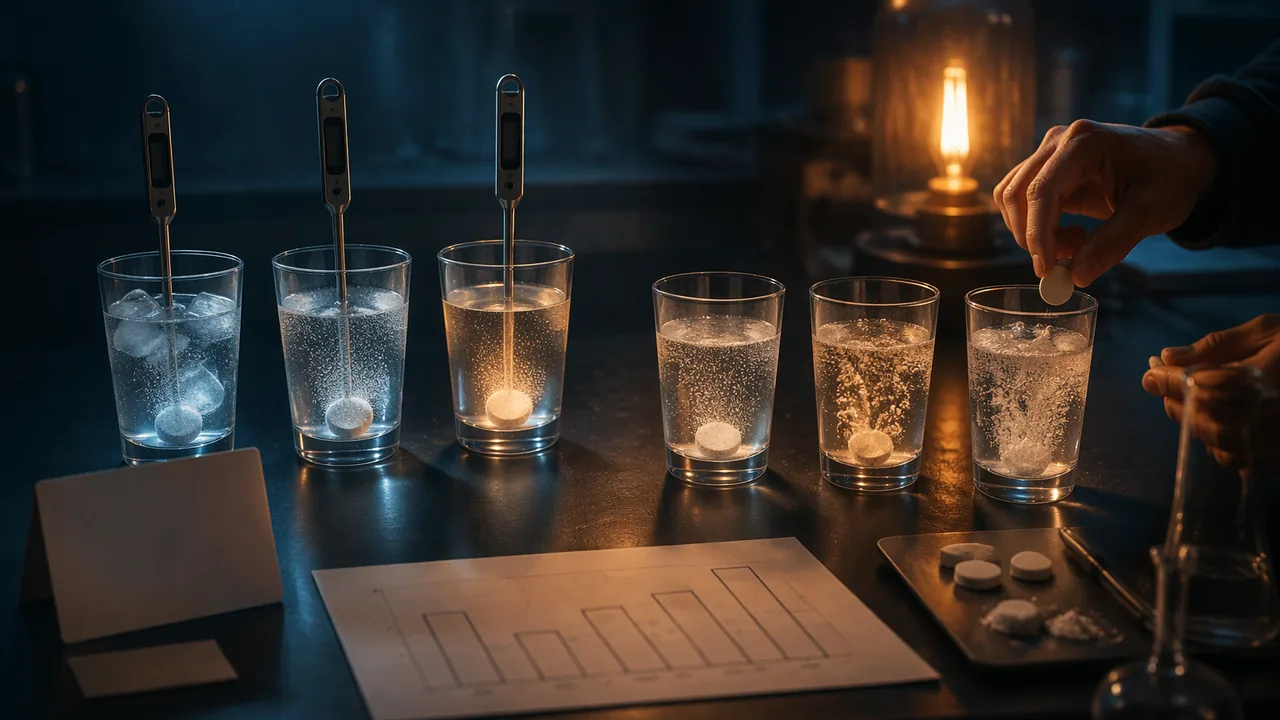
plan and carry out a fair test of how water temperature and tablet surface area change the rate of an effervescent reaction, graph the results and explain them with collision theory.
Instruction
The reaction. An effervescent antacid tablet contains sodium hydrogen carbonate (baking soda) and citric acid, pressed together dry. Nothing happens while the tablet is dry, because the particles cannot move to collide. Drop it in water and the acid and the hydrogen carbonate dissolve, collide and react, producing carbon dioxide bubbles, the same kind of acid-carbonate reaction you used in the sealed bag. When the fizzing stops, the reaction is complete. That makes it a safe, inexpensive way to measure a reaction rate.
Measuring rate. You will record the time from when the tablet touches the water until the last fizzing stops. A shorter time means a faster reaction. To turn time into a rate, use rate = 1 ÷ time; if you multiply by 100, the numbers are easier to read. For example, a tablet that takes 48 s has a relative rate of 100 ÷ 48 = 2.1, and one that takes 24 s has a rate of 4.2, twice as fast.
Two experiments. Experiment 1 changes temperature: ice water (about 5 °C), room-temperature water (about 20 °C) and warm tap water (about 40 °C), always with a whole tablet. Experiment 2 changes surface area at room temperature: a whole tablet, a tablet broken into quarters, and a tablet crushed to powder in a folded paper. Each experiment changes one variable only.
Controlled variables. Same brand and size of tablet, same volume of water (150 mL), same cup, no stirring, and the same person calling “stop.” Measure the actual water temperature with a kitchen or digital thermometer right before each drop; do not assume. (No thermometer? Run the trials anyway and use the temperatures recorded in this lesson’s reading as estimates.) Run each condition at least twice and average the times, because judging the exact end of fizzing is the largest source of uncertainty.
What to expect. Illustrative results from a trial run: 5 °C took about 92 s, 20 °C about 48 s and 40 °C about 24 s, so the rate at 40 °C was almost four times the rate at 5 °C (92 ÷ 24 = 3.8). Your numbers will differ with the brand and the water, and that is fine: the pattern is the evidence. Crushed tablets typically finish in a fraction of the whole-tablet time.
Graphing. For Experiment 1, put temperature on the x-axis (the independent variable) and relative rate on the y-axis (dependent). Plot the averages and draw a smooth curve, not dot-to-dot lines. For Experiment 2, surface area is a category, not a number, so use a bar graph. A graph lets you describe a trend (“rate increases as temperature increases, and the increase gets steeper”) and compare it with the rule of thumb from Lesson 4.1.
Connecting to collision theory. In warm water the dissolved acid and carbonate particles move faster, and more of their collisions have at least the activation energy. A crushed tablet exposes far more surface, so more particles dissolve and meet at once. Your explanation should name the particle-level cause for each variable, not just the trend.
Safety. Tell a parent or guardian before you start, and wear safety glasses or goggles: fizzing can spray droplets. Warm water comes from the tap, never from a kettle or stove. Antacid tablets are medicine; do not eat them, and keep them away from young children and pets.
📖 Read for this lesson
The reading opens over the lesson; close it to come back to exactly where you were. The checks below draw on it.
Lab: Effect of Temperature and Surface Area on Reaction Rate
Question. How do water temperature and tablet surface area change the rate at which an effervescent antacid tablet reacts?
Materials
- Effervescent antacid tablets, all the same brand, 8-10
- Three clear drinking glasses or plastic cups (250 mL or larger) and a kitchen measuring cup
- Ice water, room-temperature water, and warm tap water (no hotter than about 45 °C)
- Kitchen or digital thermometer (if you have none, use the recorded temperatures in this lesson’s reading), stopwatch or phone timer, a folded sheet of paper and a spoon for crushing
- Safety glasses or goggles, paper towels
- Tell a parent or guardian before you start, and wear safety glasses or goggles throughout: fizzing tablets can spatter.
- Use warm tap water only, no hotter than about 45 °C; check it with the thermometer, or have a parent or guardian check it. No kettles, stove or microwave.
- Do not eat the tablets or drink any solution; keep tablets away from young children and pets. Pour spent solutions down the drain with running water.
Procedure
- Measure 150 mL of ice water (remove the ice), record its temperature, drop in one whole tablet and start the timer. Stop when fizzing ends. Repeat once.
- Repeat step 1 with room-temperature water and with warm tap water, recording the temperature each time.
- At room temperature, time one whole tablet, one tablet broken into four pieces, and one tablet crushed to powder (tip all the powder in at once). Repeat each once.
- Average the two times for each condition and calculate relative rate = 100 ÷ average time.
- Graph relative rate against temperature (line graph) and relative rate for the three surface areas (bar graph).
- Compare your averages with the six recorded runs in this lesson’s reading. Are your times longer, shorter or about the same, and is your trend the same?
Data
| Condition | Water temp (°C) | Time trial 1 (s) | Time trial 2 (s) | Average time (s) | Relative rate (100 ÷ avg) |
|---|---|---|---|---|---|
| Cold, whole | |||||
| Room, whole | |||||
| Warm, whole | |||||
| Room, quartered | |||||
| Room, crushed |
Analysis
- Claim: how does temperature affect the reaction rate? Evidence: your averages and graph. Reasoning: explain the trend with collision frequency and the fraction of collisions that reach the activation energy.
- Claim: how does surface area affect the rate? Use your bar graph and explain with the number of particles exposed.
- Compare your warm-to-cold rate ratio with the ‘doubles every 10 °C’ rule of thumb. Does your data roughly agree? Suggest why it might not match exactly.
- Identify the largest source of uncertainty and one change to the procedure that would reduce it (for example, measuring gas volume instead of judging when fizzing stops).
- Use your results to explain why strawberries are cooled within hours of picking and why cut fruit spoils faster than whole fruit.
If you cannot do this lab in person: No tablets or thermometer? Use the six recorded at-home runs in this lesson’s reading, which give both trials for every condition, to average, graph and write your analysis, and use the PhET Gas Properties simulation to connect temperature with particle speed.
Formative check
Work through these before moving on. They are not graded — they tell you whether the standard below has landed yet.
Rank the reaction times from shortest to longest: whole tablet in warm water, whole tablet in ice water, crushed tablet in room-temperature water.
A tablet takes 40 s at 20 °C and 20 s at 35 °C. The relative rates (100 ÷ time) are
Stirring the warm cup but not the cold cup would still give a fair test of temperature.
Write your claim-evidence-reasoning paragraph for the temperature experiment. Include your average times, your warm-to-cold rate ratio, and a particle-level explanation.
How confident are you that you can plan a fair rate investigation and explain the effects of temperature and surface area with collision theory?
Practice
Work these on paper or in your notebook, then open Check your answer. Aim for all of Fluency and Application; try at least one Challenge.
Printable version: this unit’s practice workbook (PDF)
Fluency
Build speed and accuracy with the core skill.
- A tablet takes 50 s to react. What is its relative rate (100 ÷ time)?
Check your answer
Answer: 2.0 - A tablet reacts in 25 s in one trial and 50 s in another. How many times faster was the first?
Check your answer
Answer: Twice as fastRate is proportional to 1/time: 50 / 25 = 2. - In the temperature experiment, name the independent variable, the dependent variable and three controlled variables.
Check your answer
Answer: Independent: water temperature. Dependent: reaction time (rate). Controlled: tablet brand and size, water volume, no stirring (and same cup). - Which graph type suits temperature against rate, and which suits whole, quartered and crushed against rate?
Check your answer
Answer: A line (or scatter) graph for temperature; a bar graph for the surface-area categories. - Two trials at 20 °C took 46 s and 50 s. What is the average time?
Check your answer
Answer: 48 s
Application
Use the skill in context. Show your reasoning.
- Illustrative averages from several at-home runs: 5 °C, 88 s; 20 °C, 45 s; 40 °C, 22 s. Calculate each relative rate and the ratio of the 40 °C rate to the 5 °C rate. Does it roughly fit ‘doubles every 10 °C’?
Check your answer
Answer: Rates 1.14, 2.22, 4.55. Ratio 4.0. The rule of thumb predicts about 23.5 ≈ 11 for a 35 °C rise, so the tablet reaction is less temperature-sensitive than the rule suggests; the rule is only a rough guide, and dissolving as well as reacting is being timed.100/88 = 1.14; 100/45 = 2.22; 100/22 = 4.55; 88/22 = 4.0. - At room temperature a whole tablet took 45 s and a crushed tablet 12 s. How many times faster was the crushed tablet, and why?
Check your answer
Answer: About 3.75 times faster. Crushing exposes far more surface, so many more particles dissolve and collide at once.45 / 12 = 3.75. - A student’s times were consistently 10 s longer than the recorded runs in the reading at every temperature. Suggest a likely cause and explain why the student’s trend is still useful evidence.
Check your answer
Answer: A systematic difference, such as a different tablet brand or calling ‘stop’ later. Because the offset is the same at every temperature, the trend (faster when warmer) is still clear.
Challenge
Stretch problems. Expect to think before you write.
- Design a better measurement of rate for this reaction than ‘time until fizzing stops,’ using only inexpensive equipment. Explain why it is better.
Check your answer
Answer: Collect the CO2 in an inverted water-filled measuring cylinder (or measure the balloon or bag size, or the mass lost on a balance) every 10 s. It gives a measured quantity over time instead of a judgment of the end point, and shows how the rate changes during the reaction.
Review
Keep earlier skills sharp.
- How many moles are in 180.0 g of O2?
Check your answer
Answer: 5.625 molDivide by the molar mass, 32.00 g/mol. - Estimate the energy change for 2H2 + O2 → 2H2O using H–H 436, O=O 498 and O–H 464 kJ/mol.
Check your answer
Answer: −486 kJ (exothermic)Broken 1,370; formed 1,856; 1,370 − 1,856 = −486.
Racing Antacid Tablets: Six Recorded At-Home Runs
SLS original recorded data set for the Lesson 4.2 procedure (illustrative: six runs, each condition timed twice) · SLS original (constructed teaching data, labeled illustrative)
Why this reading. The lab’s alternative route uses this data set: six complete runs of both experiments (temperature and surface area), with both trials for every condition, so a student without tablets or a thermometer can still average, graph and write the claim-evidence-reasoning paragraph. If you ran the lab, compare your own averages with these. This data is SLS original and illustrative, built to match the illustrative numbers in the mini-lecture (about 92 s at 5 °C, 48 s at 20 °C, 24 s at 40 °C for a whole tablet).
Experiment 1: temperature (whole tablet, 150 mL water)
| Run | Cold: temp (°C) / trial 1 / trial 2 (s) | Room: temp (°C) / trial 1 / trial 2 (s) | Warm: temp (°C) / trial 1 / trial 2 (s) |
|---|---|---|---|
| 1 | 4.5 / 95 / 90 | 21 / 47 / 50 | 41 / 23 / 25 |
| 2 | 5.0 / 88 / 93 | 20 / 49 / 46 | 39 / 26 / 24 |
| 3 | 4.0 / 97 / 91 | 21 / 48 / 49 | 42 / 22 / 24 |
| 4 | 5.5 / 90 / 87 | 22 / 45 / 48 | 40 / 25 / 23 |
| 5 | 4.5 / 94 / 96 | 20 / 50 / 47 | 38 / 27 / 26 |
| 6 | 5.0 / 89 / 92 | 21 / 46 / 47 | 41 / 24 / 22 |
| Average of six runs | 4.75 °C, 91.8 s | 20.8 °C, 47.7 s | 40.2 °C, 24.3 s |
Relative rate (100 ÷ average time): cold, 100 ÷ 91.8 = 1.09; room, 100 ÷ 47.7 = 2.10; warm, 100 ÷ 24.3 = 4.12. Warm-to-cold ratio: 91.8 ÷ 24.3 ≈ 3.8, matching the mini-lecture’s illustrative 92 ÷ 24 = 3.8. The temperature rose about 35 °C (4.75 to 40.2 °C), about 3.5 ten-degree steps, so the “doubles every 10 °C” rule predicts about 23.5 ≈ 11. A ratio of 3.8 is well below that. This is a real and expected result: the rule is only an approximation, and the time you measure includes the tablet dissolving and breaking apart, not just the reaction.
Experiment 2: surface area (room temperature, 150 mL water)
| Run | Whole: trial 1 / trial 2 (s) | Quartered: trial 1 / trial 2 (s) | Crushed: trial 1 / trial 2 (s) |
|---|---|---|---|
| 1 | 47 / 50 | 22 / 24 | 9 / 11 |
| 2 | 49 / 46 | 23 / 21 | 10 / 9 |
| 3 | 48 / 49 | 21 / 23 | 8 / 10 |
| 4 | 45 / 48 | 24 / 22 | 11 / 10 |
| 5 | 50 / 47 | 22 / 25 | 9 / 8 |
| 6 | 46 / 47 | 23 / 22 | 10 / 9 |
| Average of six runs | 47.7 s | 22.7 s | 9.5 s |
Relative rate: whole, 2.10; quartered, 4.41; crushed, 10.5. Quartering the tablet roughly doubled the rate (47.7 ÷ 22.7 ≈ 2.1), and crushing it made the reaction about five times faster (47.7 ÷ 9.5 ≈ 5.0), consistent with far more surface exposed to the water at once, as in the mini-lecture’s geometry example (cutting a 2 cm cube into eight 1 cm cubes doubles the surface area).
Using this record
Graph relative rate (y) against temperature (x) as a line graph for Experiment 1, and draw a bar graph for the three surface-area conditions in Experiment 2, using the averages above (or your own). In your claim-evidence-reasoning paragraph, cite specific average times and the warm-to-cold ratio (3.8), note that it runs below the rule-of-thumb prediction of about 11, and explain both trends with collision theory: temperature raises the fraction of collisions that reach the activation energy; surface area raises the number of particles available to collide at all.