4.08 Critique, Shake Test and Retrofit Version 2
test a retrofit against its criteria, compare results with expectations, judge when a solution’s negative consequences outweigh its benefits, and use critique to build version 2.
- I can identify when a solution’s possible negative consequences outweigh its benefits.
- I can describe which parts of a complex real-world problem might still exist even after a proposed solution is put into place.
- I can interpret the results of the simulation and predict how proposed solutions will affect the systems involved.
Phase 4: Build
Warm-Up ~5 min
Do Now. Your V1 either passed or failed. Write one sentence about what you expected, one about what happened, and one guess about why they differ.
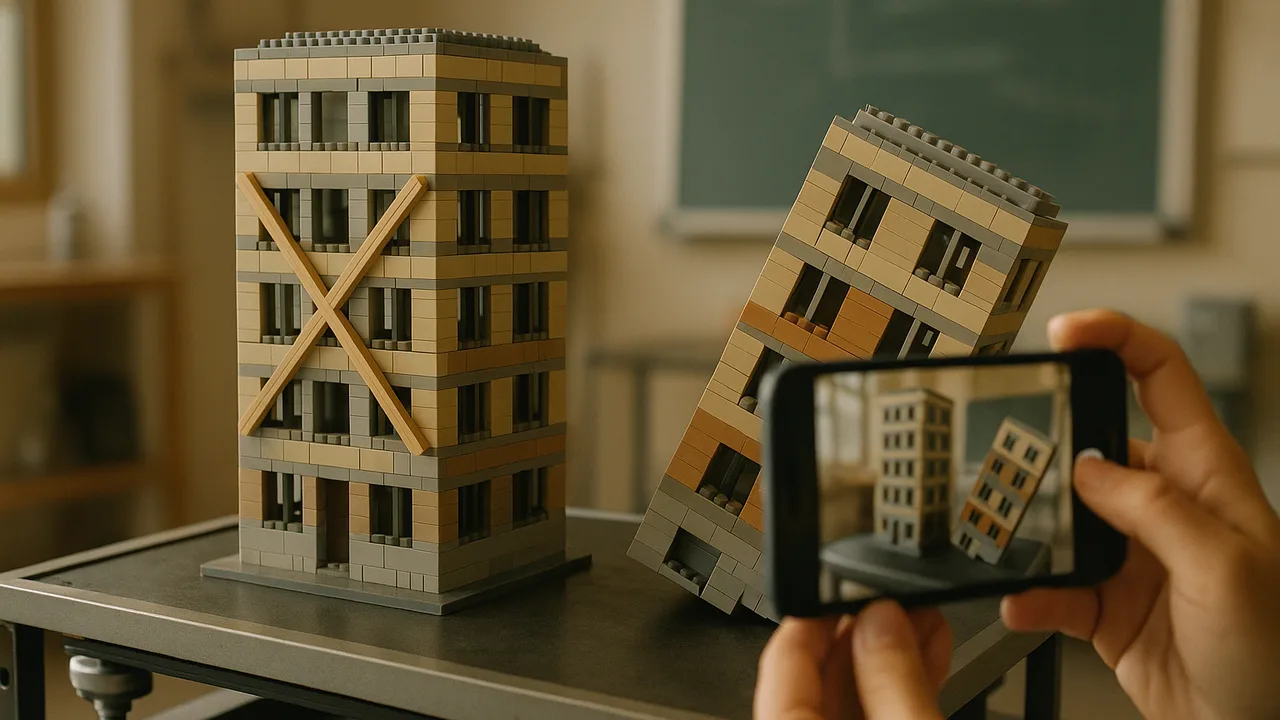
A team's X-braced model passed every shake test, but the bracing fills both shop openings. Should the council choose it?
Instruction ~10 min
Test against the criteria (sample class results).
| Model | Cost (points) | Openings clear? | Average top shift (mm) | With 200 g (mm) | Result |
|---|---|---|---|---|---|
| Base, no retrofit | 0 | yes | 34 | collapsed at 6 s | fails C1, C2 |
| X-bracing V1 | 8 | no | 4 | 7 | fails K2 |
| Corner frame V1 | 10 | yes | 15 | 24 | fails C1, C2 |
| Shear walls V1 | 11 | yes | 9 | 13 | fails C2 |
| Shear walls V2 (walls taped full height, plus one gusset at each front corner) | 12 | yes | 6 | 9 | meets all |
Sample results from one class run; your values will differ.
Worked example 1: reading the results. Every retrofit beat the base model, which matches our 4.05 evidence that stiffening the weak story matters most. The corner frame surprised its team: they expected it to rival the walls, but tape joints are not truly rigid, so it shifted 15 mm. That gap between expectation and result is information: a real moment frame uses welded steel, and our model cannot represent it well, a limit of the simulation. Shear walls V2 met every criterion and constraint at exactly the 12-point limit.
Worked example 2: when costs outweigh benefits. X-bracing gave the smallest shift, 4 mm, but only 2 mm better than shear walls V2 (4 versus 6 mm, and 7 versus 9 mm with the load), while closing both shop fronts. For a downtown that depends on those shops, the negative consequences outweigh that small gain. A retrofit that is so expensive that rents rise and tenants must leave can fail in the same way.
What the retrofit does not solve. A braced building can still lose windows, ceilings and water pipes; gas lines can still break and start fires; streets can still be blocked. Name these residual problems in your proposal.
Gallery critique. Models and test tables go on the tables. Visitors leave notes in three colors: I like (what works, with evidence), I wonder (a question about a criterion or the data), What if (a specific change). Then teams retest and build version 2.
Guided Exercises ~15 min
Run the gallery, then retest and revise.
Independent Practice ~10 min
Build and test version 2, then reflect.
Complete the test table for V1 and V2. For each change, name the critique note or failed criterion that caused it, and compare the result with what you expected.
Write the “what remains” paragraph for the council: two parts of the earthquake problem your retrofit does not solve, and one smaller solution for each.
🔎 Mini case study: Two earthquakes in 2010 ~8 min
On January 12, 2010, a magnitude 7.0 earthquake struck close to Port-au-Prince, the capital of Haiti. Many buildings had been built without enforced earthquake codes, and huge numbers of concrete and masonry buildings collapsed. Estimates of the deaths vary widely, from tens of thousands to more than two hundred thousand. Six weeks later, on February 27, 2010, a magnitude 8.8 earthquake struck central Chile. Each step of 1 in magnitude releases about 32 times more energy, so the Chile earthquake released several hundred times more energy than Haiti’s. Chile, which has a long history of great earthquakes, had modern building codes that were widely enforced. Some buildings failed and a tsunami struck the coast, but the death toll was in the hundreds. The hazard was larger in Chile; the risk was far larger in Haiti, because of vulnerability and exposure.
Think about it: Use hazard, exposure and vulnerability to explain how a much stronger earthquake caused far fewer deaths. What does this suggest for the client town’s downtown?
Closure ~5 min
Version 2 is tested. Next phase: the full engineering proposal and its defense to the town council.
How confident are you that you can I can test a solution, interpret the results and judge when its negative consequences outweigh its benefits.
Exit ticket: which critique note changed your design most, and what did the change do to your results?
Teacher notes
Materials: V1 models, the shake table, sticky notes in three colors, extra straws, tape and card, 200 g weights, test tables.
Setup: gallery for 12 minutes, then retesting. Collect each team’s V1 and V2 table for the 4.09 proposal.
Facts to keep careful: the case study uses the two magnitudes, dates and ranges only; Haiti’s death toll estimates differ greatly between sources, so keep the range. The energy ratio for 1.8 magnitude units is about 102.7, roughly 500.
Listen for: “strongest wins”; V2 changes not linked to a critique; leaving residual risk out.
Support / stretch: give a two-option menu of V2 changes. Stretch: compute the benefit-cost ratio of retrofitting one building using an illustrative expected annual loss, and compare with the wildfire example in 4.05.