1.08 Critique, Test and Version 2
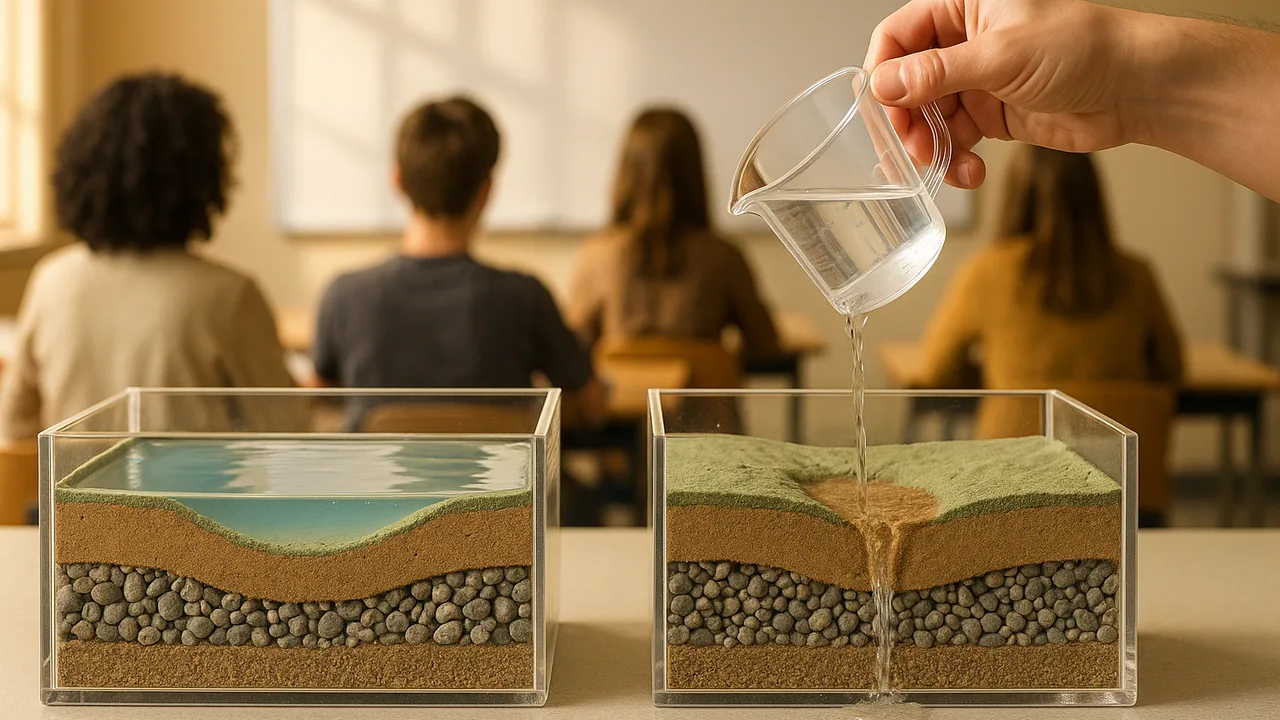
run a gallery critique, test the recharge-pond bed and the basin plan against our criteria, evaluate the accuracy of our data, and build an improved version 2.
- I can evaluate how accurate and precise my collected data is.
- I can revise my investigation plan to improve the accuracy and precision of my data if needed.
- I can compare my simulation results to real-world examples and determine how realistic my simulation is.
Phase 4: Build
Warm-Up ~5 min
Do Now. Your bed’s two version-1 trials took 48 s and 71 s. Write what that spread tells you about precision, and one reason it might have happened.
If two trials of the same bed differ a lot, we should average them and stop testing.
Instruction ~10 min
Class criteria and constraints (set in 1.07, used through 1.09). Basin plan, tested in the model basin with the wet-dry sequence: (C1) storage at the end of year 20 is at least the starting 2,000,000 acre-feet; (C2) the creek flows every year (storage above 1,200,000); constraint (K1) pumping is cut by no more than 20%, to protect farm jobs; constraint (K2) managed recharge is at most 150,000 acre-feet in a wet year, the capacity of the district’s possible recharge ponds. Recharge-pond bed prototype: (C3) 250 mL of muddy water soaks through in 60 seconds or less; (C4) the water that comes out scores 3 or better on the 5-point clarity card; (K3) materials cost no more than 10 sample budget points; (K4) the top layer lifts out for cleaning.
Gallery critique. Each team displays its bed, its decision matrix and its model graph. Visitors leave three sticky notes: I like… (something that works, with evidence), I wonder… (a question about a criterion or the data) and What if… (a specific change). Feedback names the criterion it is about.
Test against the criteria. Run three trials of version 1 with a fresh batch of muddy water each time, and record soak time and clarity. Then run your plan in the model with both the wet-dry sequence and a harsher one (three dry years in a row twice in 20 years).
| Test | V1 result | Meets? | Change for V2 | V2 result | Meets? |
|---|---|---|---|---|---|
| C3 soak time (mean of 3) | |||||
| C4 clarity (median of 3) | |||||
| K3 budget points | |||||
| C1 storage year 20 (model) | |||||
| C2 creek every year (model) |
Worked example 1: accuracy and precision. Ava’s soak times were 48, 71 and 52 s. The 71 s run used muddier water because the soil settled in the jug. She stirred before every pour and re-ran: 50, 53, 49 s. The method change raised precision. Accuracy, closeness to the true value, needs a check against a standard: she timed plain water through a known gravel bed to confirm the stopwatch method.
Worked example 2: version 2. Jamal’s V1 (2 cm fine sand over 4 cm gravel) scored clarity 4 but took 85 s, failing C3. Critique asked, “What if the fine layer were thinner?” V2 used 1 cm fine sand on a filter over gravel: 58 s, clarity 3, 7 budget points. It meets every criterion, with less margin on clarity: a trade-off he will report honestly.
How realistic is our simulation? Real basins show the same broad behavior: decline in droughts, partial recovery in wet years, and recharge ponds that must be cleaned. Our model leaves out uneven pumping across the valley, how fast water spreads underground, and climate change shifting snow to rain. Each limit belongs in the final plan.
Guided Exercises ~15 min
Critique, test, then answer.
Independent Practice ~10 min
Build and test version 2, then reflect.
Complete the test table for V1 and V2. Explain how the change you made affected how water moved through the materials and what it trapped, and judge whether your data are precise and accurate enough to recommend the design.
Revise your test plan: name one change to the procedure that would make your next round of data more accurate or precise.
🔎 Mini case study: The High Plains Aquifer ~8 min
The High Plains Aquifer, which includes the Ogallala Formation, lies under parts of eight states in the central United States and waters one of the country’s biggest farming regions. Since large-scale irrigation began, the U.S. Geological Survey has tracked its water levels in thousands of wells. In parts of the southern and central plains, water levels have fallen by more than 30 m, while other areas have changed little, because recharge there is slow and pumping is heavy. Some wells have been pumped until they could no longer supply irrigation, and farms have switched to dryland crops. In response, some local districts have tried farmer-led limits. In one district in northwest Kansas, farmers agreed to cap their own pumping for a set period starting in 2013, and studies since have tracked how water levels and farm income responded.
Think about it: How does the High Plains Aquifer show both a pumping cut and uneven change across a basin, and what would our one-tub model miss about it?
Closure ~5 min
Version 2 is tested and the plan has faced a harsher drought. Next phase: the written plan and its public defense.
How confident are you that you can I can test a design against criteria, judge the accuracy of my data and improve the design.
Exit ticket: which critique note changed your design most, and what did the change do to your results?
Teacher notes
Materials: the 1.07 kit, sticky notes in three colors, fresh muddy water mixed in a jug (stir before every pour), timers.
Setup: run the gallery for 12 minutes, then testing. Collect each team’s V1 and V2 table for the 1.09 dossier.
Facts to keep careful: the case study gives no numbers beyond the “more than 30 m” decline the USGS reports for parts of the aquifer; check the USGS High Plains Aquifer pages for current figures before adding any.
Listen for: V2 changes that are not linked to a critique or a failed criterion; “our data are perfect.”
Support / stretch: give a two-option menu of V2 changes. Stretch: graph soak time against fine-sand thickness from the whole class’s data.