2.04 What Changes Climate? Orbits, Sun, Volcanoes and Gases
compare the natural and human causes of climate change by the size of their effect on Earth’s energy flow and the time scale on which they act, and argue from evidence which explain the warming of recent decades.
- I can identify and explain the different time scales (years, decades, centuries, thousands or millions of years) on which climate-changing factors operate in a given model.
- I can describe whether the relationships between parts of a climate model are causal (one factor directly changes another) or correlational (factors change together but not necessarily because one causes the other).
- I can use a climate model to explain how specific factors cause changes in the flow of energy into and out of Earth’s systems, and how the combined effects of these factors lead to changes in climate such as surface temperature, precipitation patterns, glacial ice volume, sea level, and biosphere distribution.
Phase 2: Investigate
Warm-Up ~5 min
Do Now. Earth’s climate has changed many times without people, including ice ages. Write one thing that you think could change a whole planet’s temperature.
A large volcanic eruption blasts sulfur gases high into the stratosphere. What happens to global temperature over the next two years?
Instruction ~10 min
The same rule for every cause. Earth’s climate changes when the flow of energy in and out changes. Anything that changes how much sunlight arrives, how much is reflected, or how easily infrared energy escapes to space is a climate forcing, measured in watts per square meter (W/m2) of Earth’s surface. Positive forcings warm; negative ones cool. Climate has changed naturally many times, so the scientific question is always: which forcing, how large, and on what time scale?
1. Orbital cycles (tens of thousands of years). Earth’s orbit and tilt change slowly and regularly: the orbit’s eccentricity varies over about 100,000 and 405,000 years, the axis tilt between about 22.1° and 24.5° over about 41,000 years, and the axis wobbles (precesses) over about 23,000 years. These Milankovitch cycles hardly change the total sunlight Earth receives, but they shift how much reaches high northern latitudes in summer. Ice cores and ocean sediments show ice ages coming and going about every 100,000 years for the last 800,000 years, in step with these cycles and amplified by feedbacks from ice and carbon dioxide. They are too slow to explain changes over decades.
2. The Sun (years to centuries). The Sun’s output rises and falls by about 0.1% over its 11-year sunspot cycle. 0.1% of 1,361 W/m2 is about 1.4 W/m2; averaged over the whole globe and after reflection (× 0.7 / 4), that is only about 0.24 W/m2. Satellites have measured the Sun directly since 1978, and its average output has not risen since then, while Earth has warmed.
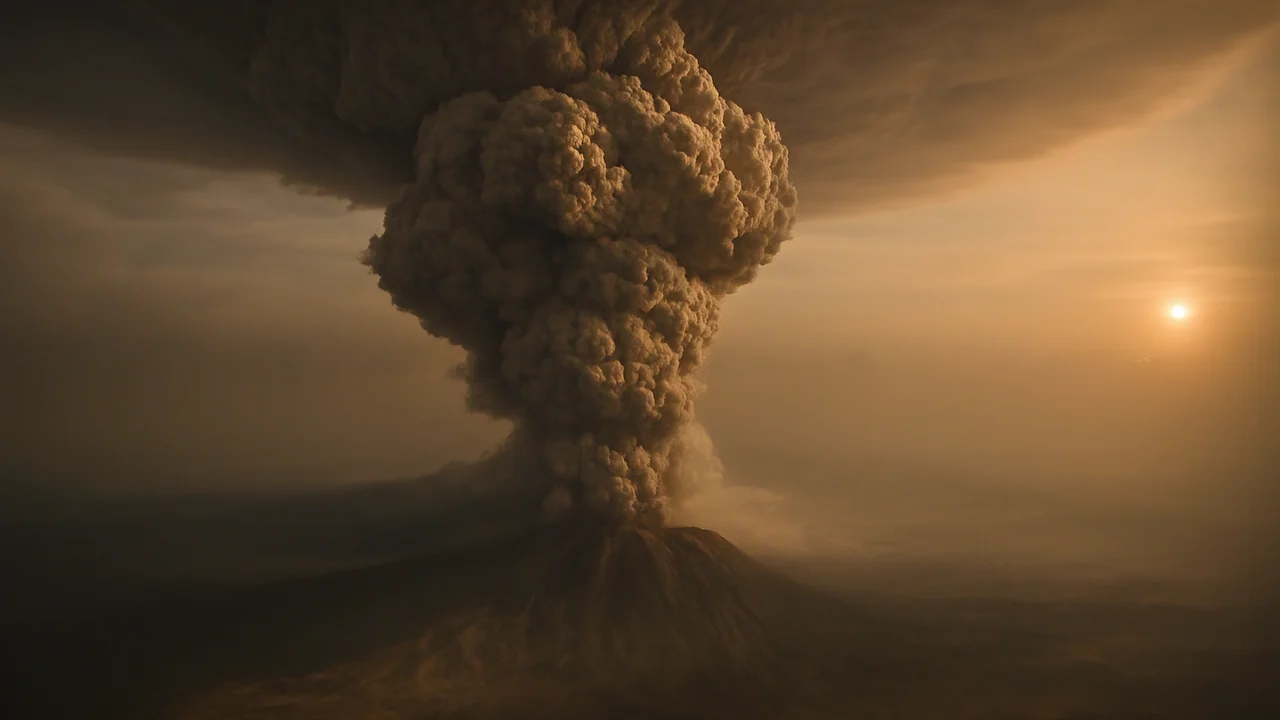
3. Volcanoes (one to a few years). Large eruptions blast sulfur gases into the stratosphere, where they form tiny droplets that reflect sunlight. After Mount Pinatubo in the Philippines erupted in June 1991, global temperatures fell by roughly 0.5 °C for a year or two, then recovered as the droplets settled out. Volcanoes also emit carbon dioxide, but far less each year than human activities.
4. Greenhouse gases (decades to centuries). Carbon dioxide absorbs infrared energy leaving Earth. Scientists estimate its forcing with the relation ΔF ≈ 5.35 ln(C/C0). From the pre-industrial level of about 280 ppm to the 2024 Mauna Loa average of 424.61 ppm, ΔF ≈ 5.35 × ln(1.516) ≈ 2.2 W/m2, roughly nine times the size of the solar cycle’s swing, and it acts in one direction, year after year. Doubling carbon dioxide gives 5.35 ln 2 ≈ 3.7 W/m2.
Fingerprints, and cause versus correlation. Two curves rising together is a correlation; a cause needs a mechanism and a pattern only that cause would make. If a brighter Sun were warming Earth, the whole atmosphere, including the stratosphere, would warm. Instead, measurements show the lower atmosphere warming and the stratosphere cooling, which is the pattern expected when greenhouse gases trap more energy lower down. Nights have also warmed faster than days in many places, another greenhouse signature.
Lab: a model volcanic haze. Question: does a haze of tiny particles between a light source and the ground reduce how much the ground warms?
- Lay two squares of black paper side by side under the lamp, with a thermometer bulb on each. Record the starting temperatures.
- Fill two clear zip-top bags with 200 mL of water each. Add a few drops (about 2 mL) of milk to one bag only and mix to make a uniform haze.
- Support each bag 5 cm above its black square so light must pass through the water to reach the paper.
- Switch on the lamp and record both temperatures every minute for 10 minutes.
- Swap which side has the hazy bag and repeat, to check that the lamp lights both sides equally.
| Time (min) | 0 | 2 | 4 | 6 | 8 | 10 |
|---|---|---|---|---|---|---|
| Under clear water (°C) | ||||||
| Under hazy water (°C) |
Record every minute; repeat with the sides swapped.
Guided Exercises ~15 min
Build the drivers table as you go: driver, size (W/m²), time scale, fits recent warming?
Independent Practice ~10 min
The argumentation lab.
Write a CER argument answering: “What is the main cause of the global warming measured since 1960?” Compare at least three drivers by the size of their forcing and their time scale, use your graph and haze data as evidence, say which relationships are causal and which only correlational, and rebut the claim “It's just the Sun.”
Share your argument with a partner and respond in writing to their strongest question.
Closure ~5 min
Every climate cause works through the same energy budget. Next phase we do the math of that budget for the whole planet.
How confident are you that you can I can compare climate drivers by size and time scale and argue from evidence about recent warming.
Exit ticket: why can a haze that lasts two years not explain a warming trend that has lasted decades?
Teacher notes
Timing: spans two 50-minute periods: day 1 drivers, haze lab and CODAP graph; day 2 the written argument and partner exchange.
Materials (per team): two clear zip-top bags, about 2 mL milk, two thermometers, two black paper squares, a desk lamp, cups or books to support the bags, stopwatch, goggles.
Data note: the CO₂ and anomaly values are NOAA Mauna Loa and NASA GISTEMP v4 figures as carried in the source course; re-check against the current NOAA and NASA releases before printing, since GISTEMP values are revised slightly over time.
Listen for: “climate always changed, so this is natural” (ask: which natural forcing, how large, on what time scale?). Keep the discussion evidence-focused and respectful.
Support / stretch: a partly filled drivers table. Stretch: compute the forcing for 560 ppm and compare it with the 2024 value.