4.06 One Town, One Risk Model: Cause, Correlation and Ideas
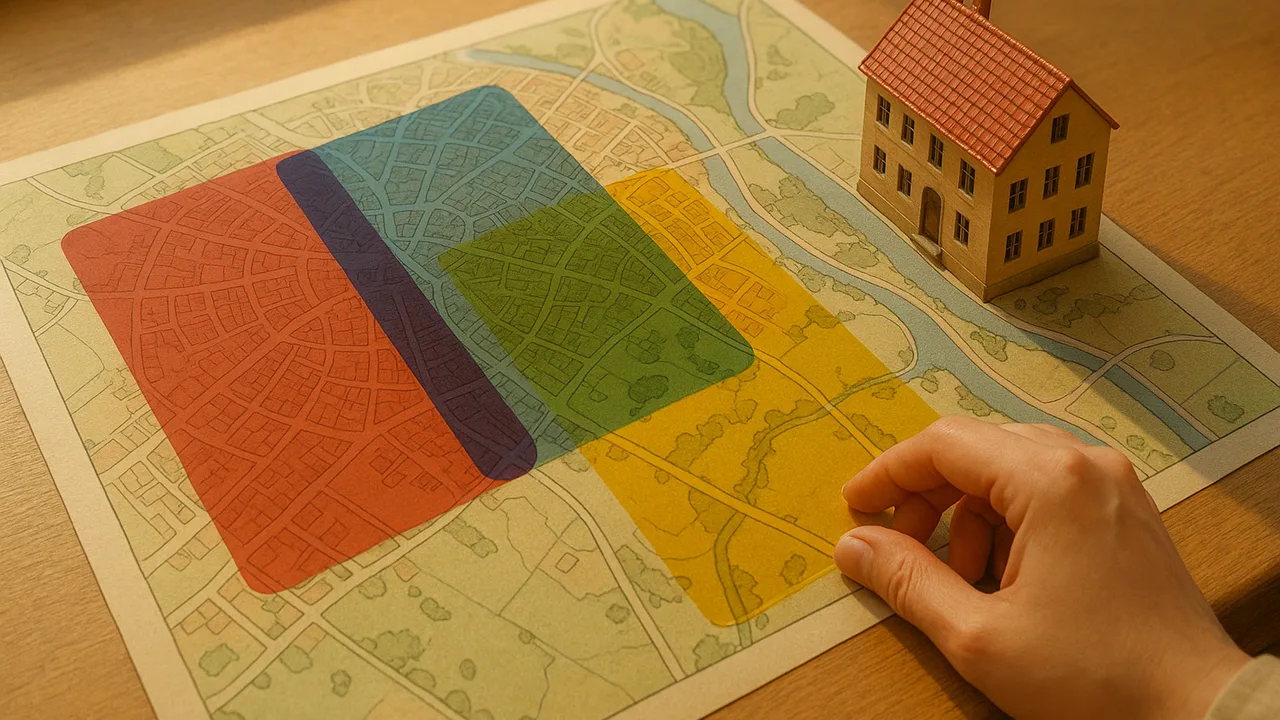
combine hazard, exposure and vulnerability into one risk model for the client town, use evidence to separate causes from correlations, judge what a solution leaves unsolved, and brainstorm solutions for the project.
- I can use reasoning and evidence, along with the assumption that scientific laws and theories remain consistent over time, to describe how natural hazards, climate changes, and resource availability affect population size and migration patterns.
- I can explain how technology has changed the cause-and-effect relationship between human society and natural hazards, climate, and natural resources.
- I can explain how the evidence helps me distinguish between causal relationships and correlations between environmental factors and human activity.
Phase 3: Make Sense
Warm-Up ~5 min
Do Now. In summer, ice-cream sales and drownings both rise. Does ice cream cause drowning? Write what is really going on in one sentence.
If two quantities rise together, one must cause the other.
Instruction ~10 min
One risk model. For each hazard, expected annual loss = (chance of the event each year) × (value exposed) × (fraction damaged if it happens). The three factors are hazard, exposure and vulnerability, and every solution in this unit lowers at least one of them: permeable pavement lowers the flood hazard downstream; zoning lowers exposure; bracing, hardening and defensible space lower vulnerability.
Worked example 1: cause or correlation?
| Decade (sample data) | Homes in the forest-edge zone | Days per year with high fire danger | Homes lost to wildfire in the decade |
|---|---|---|---|
| 1980s | 400 | 18 | 2 |
| 1990s | 650 | 22 | 5 |
| 2000s | 900 | 27 | 11 |
| 2010s | 1,300 | 33 | 40 |
Sample data for the made-up client town. It is not a measurement of any real place.
Homes lost rose twentyfold while homes in the zone rose a bit more than three times. Exposure alone cannot explain it: losses per home rose from 2 / 400 = 0.005 to 40 / 1,300 ≈ 0.031 per home per decade. The high-danger days also rose. Two causes with known mechanisms fit: more homes in the path (exposure) and drier, longer fire seasons (hazard). But four decades of one town cannot prove either alone. To argue cause, we need a mechanism (dry fuel ignites more easily), comparison with places where one factor changed and the other did not, and simulations such as the fire model that change one input at a time.
Worked example 2: the past as a key. A trench dug across the fault near town (sample data) shows four large earthquakes in about 900 years, roughly one every 150–300 years. Because the physics of faults has not changed, scientists assume the fault will keep behaving the same way, so the town should expect a large earthquake within the design life of its buildings, without knowing the year. Technology changes the outcome, not the hazard: the same shaking that would collapse an unbraced soft story leaves a retrofitted one standing.
What a solution leaves unsolved. No proposal removes all risk. Fuel breaks still leave embers; braced buildings can still be damaged; permeable pavement clogs without upkeep. Naming the residual risk is part of an honest proposal.
Refinements and their side effects. A rain garden planted with native, deep-rooted plants soaks in more water and needs less irrigation than lawn, supporting a more stable creek; but it may look “messy” to some neighbors and needs weeding. Resource choices shift too: as battery prices fall and recycling grows, the cost-benefit result from 4.04 may change.
Ideate. For your team’s hazard, brainstorm at least six solutions before judging any, at least one for each risk factor. Use “yes, and”: build on ideas, judge later.
CER sentence starters. Claim: Wildfire losses in the town rose mainly because … Evidence: From the 1980s to the 2010s … Reasoning: This is a cause, not just a correlation, because …
Guided Exercises ~15 min
Work in your team. Use the sample town data.
Independent Practice ~10 min
Write the synthesis CER.
CER: why did the town's wildfire losses rise? Use the sample data as evidence, explain the mechanisms, and say how you distinguished causes from correlations. Name one more source (a study, a simulation or your own test) that would strengthen the argument, and judge how reliable it would be.
For your team's hazard, write the risk equation in words, explain how technology has changed the town's relationship with the hazard, and name one part of the problem that would remain after any solution.
Closure ~5 min
One risk model, two causes, six ideas. Next phase: compete the two best ideas and build a prototype.
How confident are you that you can I can explain how hazards, resources and technology shape a community's risk, and tell causes from correlations.
Exit ticket: name the risk factor your favorite idea lowers, and what risk it leaves behind.
Teacher notes
Materials: sample town table, the 4.03–4.05 data, chart paper and sticky notes for the Ideate round.
Facts to keep careful: the town data and the trench record are sample data. Real paleoseismic records exist for many faults; do not attach these numbers to any real fault.
Listen for: “climate change caused it” or “more homes caused it” as the whole answer; ideas that only target the hazard.
Support / stretch: give the risk equation with blanks per hazard. Stretch: estimate the town’s expected annual earthquake loss with stated assumptions and show how a retrofit changes each factor.