1.01 Snowpack, Reservoirs and a Thirsty Valley
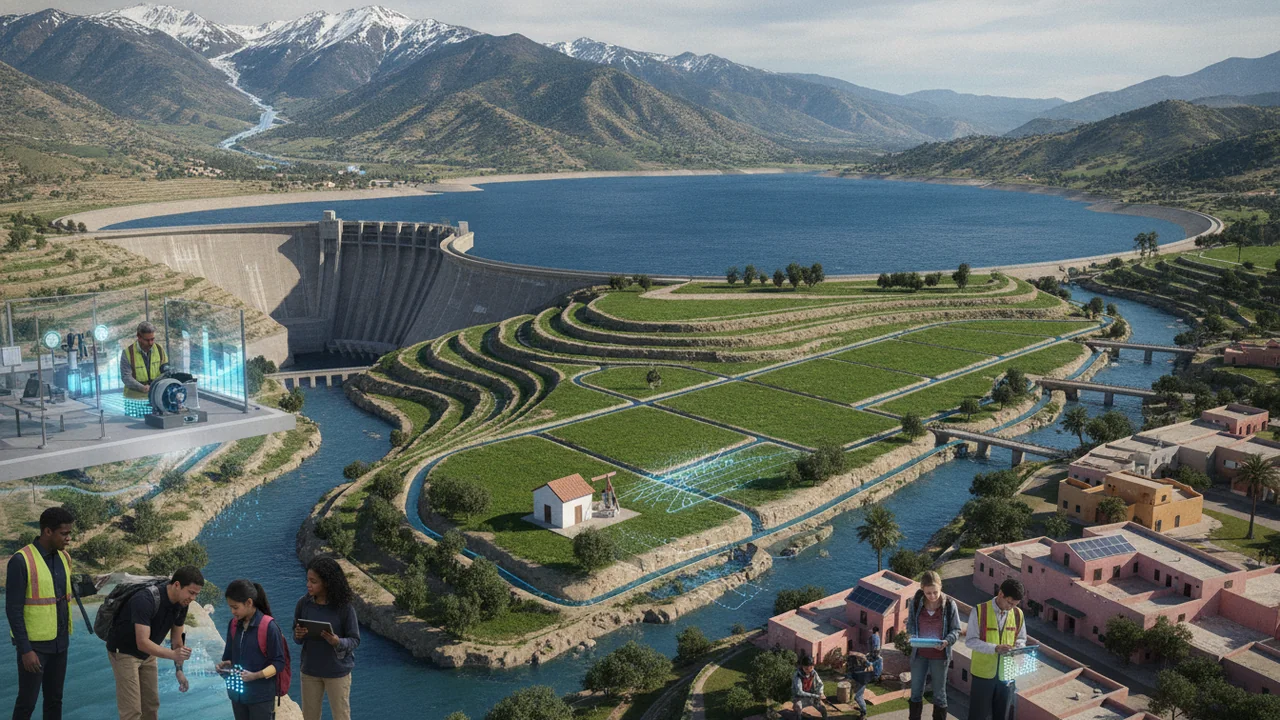
A Water Plan for One Basin
How should an overdrawn groundwater basin be managed so it can supply people, farms and ecosystems for the long term?
The mystery: In some years a mountain range’s spring snowpack holds only a small fraction of its average; in the drought that follows, a hot farm valley pumps so much groundwater that its water table falls, shallow wells go dry and the valley floor sinks.
describe a region’s water supply as a system of connected stores and flows, analyze reservoir and snowpack data, and explain how one change at the surface can trigger feedbacks in other Earth systems.
- I can organize data that show how changes to Earth’s surface affect the hydrosphere, cryosphere, atmosphere, biosphere, or geosphere.
- I can use tools, technologies, or models to analyze data and identify relationships between changes in one Earth system and changes in another or within the same system.
- I can describe possible feedbacks between Earth systems, including at least one example of climate feedback.
- I can use analyzed data to describe how feedback between two Earth systems works and explain whether the feedback is positive (increasing the original change) or negative (decreasing the original change).
Phase 1: Spark
Warm-Up ~5 min
Do Now. Two photos sit side by side on the board. Both show the same snow-survey meadow high in a western mountain range, taken on the same spring date in different years. In one, surveyors stand on deep snow. In the other, they stand on bare grass. Write three things you notice and one question about what the second year meant for the farms in the valley below.
In a year when the mountain snowpack is very small, what do you expect to happen to groundwater levels in the farm valley below?
Instruction ~10 min
The phenomenon. In many dry regions, the mountain snowpack is measured every year near April 1, because that is usually when it holds the most water. In some years the measured snowpack has been only a small fraction of its long-term average, and surveyors have stood on bare ground where there should have been meters of snow. A few years later the same mountains can hold more than twice the average. A region’s water supply can swing from famine to flood in a few years. Why, and what happens to the rest of the system when it does?
Earth’s systems. Earth scientists divide the planet into four interacting systems: the geosphere (rock, soil and sediment), the hydrosphere (all water: oceans, rivers, lakes, groundwater and ice), the atmosphere and the biosphere (living things, including people). Frozen water is sometimes split out as the cryosphere. The water cycle runs through all of them. Water evaporates from the ocean, winter storms carry it inland, and it falls as rain and, in the mountains, as snow. The snowpack is a natural reservoir: it stores winter precipitation and releases it as meltwater in spring and summer, just when farms and cities need it most.
Built reservoirs. Dams add a second store. Large reservoirs are measured in acre-feet: an acre-foot is about 1,233 m3, the water that covers an acre one foot deep.
Worked example: reading reservoir data (sample data). Reservoir A holds up to 4,500,000 acre-feet. In April of a normal year it held 2,610,000: 2,610,000 / 4,500,000 = 58.0% of capacity. In September at the end of a drought it held 1,080,000, only 24.0%. Two springs later, after a huge snow year, it held 4,370,000, or 97.1%. Notice the seasonal pattern too: between April and September of one year, its storage fell by about 1,600,000 acre-feet as water was released for farms, cities and river flows. These are sample numbers shaped like real reservoir records.
Feedbacks. A feedback is a chain in which a change in one system causes changes that loop back. A snow-poor winter starts several.
- Snow and sunlight: fresh snow reflects most sunlight; bare ground absorbs it. Less snow means warmer ground and air, which melts the remaining snow sooner: a reinforcing (positive) feedback.
- Surface water and groundwater: when rivers and reservoirs run low, farmers and towns pump more groundwater, lowering the water table.
- Groundwater and the geosphere: as water is pumped from clay layers, the clay compacts and the land surface sinks, reducing the aquifer’s ability to store water in future wet years.
Your questions. Good questions for this unit connect systems: Where does the water go when the snow melts early? How much water is underground? Why does the ground sink, and can it rise again?
Reading: Steven Earle, Physical Geology, 2nd ed., chapters 13–14 (CC BY 4.0).
Guided Exercises ~15 min
Work with your table group. Use the reservoir worked example and the river hydrograph.
Independent Practice ~10 min
Start your Basin Notebook.
Organize the sample reservoir data into a table with three columns: date, storage (acre-feet), percent of capacity. Then write two sentences describing what the data show about a change in the cryosphere affecting the hydrosphere.
Write two investigable questions about the valley's water for the class Wonder Board. One should connect two Earth systems.
Closure ~5 min
We have a phenomenon: the snow, the reservoirs and the ground beneath the valley are one connected system. Next time we meet our client.
How confident are you that you can I can analyze water data and explain how one change can cause feedbacks in other Earth systems.
Exit ticket: name one change in the snowpack and trace it through two other Earth systems.
Teacher notes
Materials: two generic snow-survey photos (deep snow and bare ground), a printed hydrograph from any snow-fed river gauge, Basin Notebooks, chart paper for the Wonder Board.
Setup: pick a USGS gauge on a snow-fed river before class; any mountain river with a spring peak works. The reservoir numbers are sample data shaped like real records; say so.
Listen for: “groundwater is an underground lake” (flag it for 1.03); feedbacks described as one-way chains with no loop back.
Support / stretch: give a partly drawn system model with the stores placed. Stretch: add a balancing feedback to the model and explain it.