4.05 Simulating Solutions: Fire Spread and Shaking
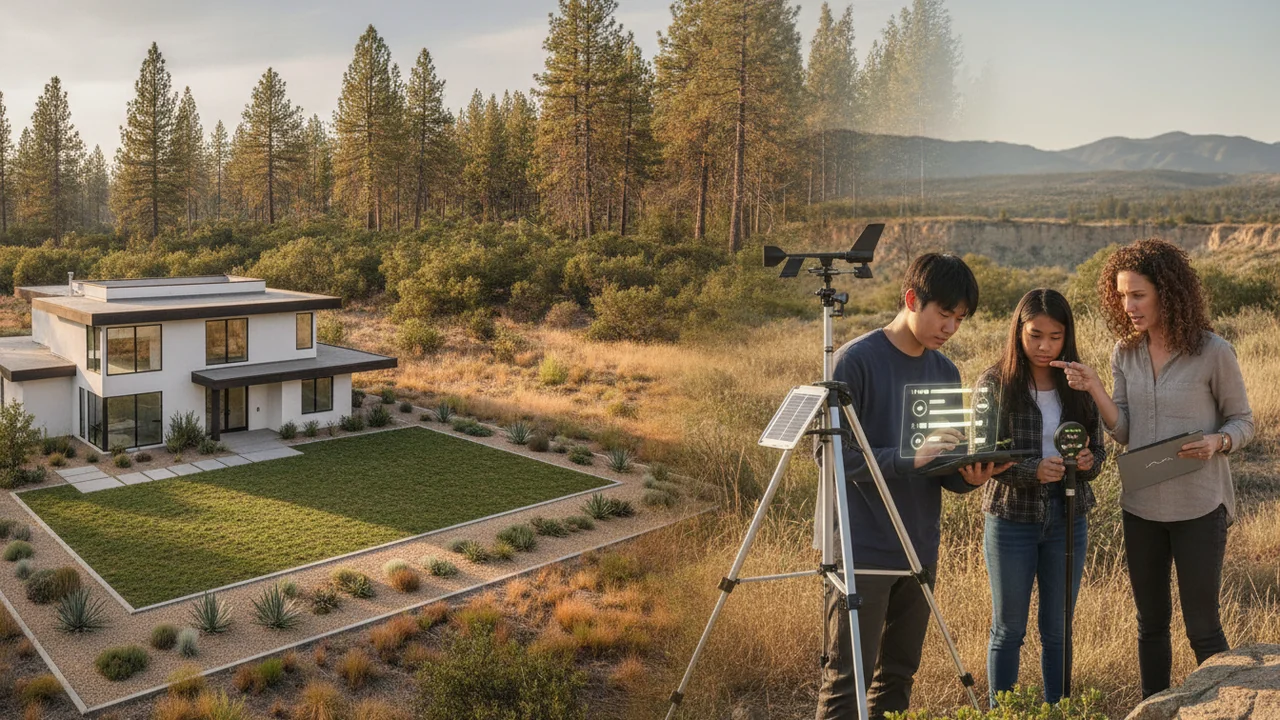
use a computer simulation of fire spread and a hands-on shake-table test to model how proposed solutions change the impact of a hazard, and explain what each model can and cannot show.
- I can identify the complex real-world problem being modeled in a computer simulation, including its criteria and constraints.
- I can describe the system being modeled, including its boundaries.
- I can identify which variables I can change in the simulation and explain the scientific principles or relationships the model uses.
- I can select logical and realistic inputs when using a computer simulation.
- I can use the simulation to test the effects of different solutions, tradeoffs, or decisions.
- I can identify the limitations of the computer simulation.
Phase 3: Make Sense
Warm-Up ~5 min
Do Now. Name two hazards engineers cannot create on purpose to test a solution. How could they test it anyway?
In a grid of trees, fire spreads only to touching neighbors. As tree density rises from 50% to 70%, the area burned…
Instruction ~10 min
Why simulate? We cannot start a wildfire or an earthquake to test a solution. Engineers instead use models: computer simulations that follow simple rules many times, and physical tests at small scale. Each model captures part of the real system and leaves the rest out, so a good engineer uses more than one and says what each misses.
A simulation of fire spread. The NetLogo Fire model (from the NetLogo Models Library) fills a grid with trees at a chosen density: the chance that any square holds a tree. Fire starts along the left edge. Each step, a burning tree ignites any tree directly next to it, then burns out. The system’s boundary is the grid; its one input is density; its output is the percent burned. At low density, the fire finds too few neighbors and dies out. At high density, it sweeps across almost everything. Between them lies a sharp threshold, close to 59% density in this model, where a small change in density makes a huge change in the area burned. Physicists call this percolation.
| Tree density (%) | 50 | 55 | 58 | 60 | 62 | 65 | 70 |
|---|---|---|---|---|---|---|---|
| Percent burned, average of three runs (illustrative) | 3 | 8 | 22 | 62 | 81 | 93 | 98 |
| Your class’s average |
Illustrative values shaped like typical runs of the model, for students without a device. Your runs will differ, especially near the threshold.
From model to landscape. Real fire depends on wind, slope, moisture and the type of fuel, which this model leaves out. But its central idea matches what fire scientists observe: connectivity of fuel controls spread. That is why solutions aim at breaking connections. Fuel breaks clear strips of vegetation; prescribed burns and thinning lower fuel density; and defensible space around homes (some fire-prone regions require owners to clear or reduce vegetation within about 30 m, or 100 feet, of buildings) keeps fire from reaching walls. Home hardening, such as ember-resistant vents and non-combustible roofs, reduces vulnerability even when fire arrives, because many homes ignite from wind-blown embers.
Worked example 1: benefit of defensible space (illustrative). A home worth $600,000 has a 1% chance a year of burning. If clearing and hardening costing $5,000 lowers that to 0.4%, the expected savings are (0.010 − 0.004) × $600,000 = $3,600 a year, or $36,000 over 10 years: a benefit-cost ratio of 36,000 / 5,000 = 7.2. Real probabilities depend on the location.
A physical model of shaking. Buildings fail in earthquakes when ground motion pushes their base back and forth faster than the structure above can follow, so walls rack sideways. Diagonal bracing turns rectangles into triangles, which cannot change shape without changing the length of a side, so a braced frame resists racking. Many older apartment buildings with open ground-floor garages, called soft-story buildings, are weak for exactly this reason, and several large cities near active faults have required their owners to retrofit them.
Lab: Shake-table test of braced and unbraced towers. Question: does diagonal bracing help a small tower survive shaking, and how does adding weight at the top change the result?
- Build two towers at least 30 cm tall with the same number of straws and the same length of tape: tower A with rectangular frames only, tower B with a diagonal brace across every rectangular face.
- Tape each tower’s base to the pan, which rests on 4–6 tennis balls or marbles. Test tower A: pull the string back and forth 10 cm each way at a steady rhythm (one full cycle per second) for 10 seconds. Record whether it stands, leans (measure the top’s sideways shift) or collapses.
- Repeat with tower B.
- Tape a 200 g weight to the top of each tower and repeat both tests.
- Run each test twice and record the average sideways shift of the top, or the time to collapse.
| Tower | Top weight (g) | Trial 1: top shift (mm) or time to collapse (s) | Trial 2 | Average |
|---|---|---|---|---|
| A unbraced | 0 | |||
| B braced | 0 | |||
| A unbraced | 200 | |||
| B braced | 200 |
Worked example 2: comparing models. The NetLogo model lets you run hundreds of trials quickly but uses very simple rules. The shake table has real forces but only a few trials and an unrealistic scale. Your write-up should use evidence from both, compare each result with what you expected, and state what each cannot tell you about a real town.
Guided Exercises ~15 min
Run the simulation, then the shake table.
Independent Practice ~10 min
Write up both models.
CER: does bracing improve performance in shaking? Use your top-shift or collapse data, with and without the weight, as evidence, and explain why triangles resist racking. Relate the result to soft-story buildings: which tower behaves like one, and what retrofit would help?
Compare your two models. For each, state the problem it models, its boundary and inputs, one thing it shows well about reducing hazard impact, one thing it leaves out, and how you would use its result in a proposal to the town council.
Closure ~5 min
Break the connections and fire stops; add triangles and frames stand. Next lesson we pull the hazard and resource evidence into one risk model.
How confident are you that you can I can use a computer simulation and a physical test to model how solutions change a hazard's impact.
Exit ticket: name one thing each model cannot tell the council, and how you would find it out.
Teacher notes
Timing: this workshop spans two 50-minute periods: day 1 NetLogo runs and graphing; day 2 tower building, shake tests and the model comparison.
Materials (per team): a shallow pan resting on 4–6 tennis balls or marbles with a string attached; 20 straws or craft sticks per tower; 1 m masking tape per tower; scissors; a 200 g weight; ruler; timer; goggles; devices for NetLogo Web, or dice and printed grids.
Facts to keep careful: the 59% threshold is the model’s (site percolation on a square grid, about 0.593). The fire table and the defensible-space example are illustrative.
Listen for: treating the model’s threshold as a real forest value; “more material always means stronger”.
Support / stretch: give the graph axes pre-drawn. Stretch: run the model at 59% ten times and describe the spread of results. Reading: Earle, Physical Geology, chapter 11.