describe the decline and lek breeding behavior of greater prairie-chickens in Missouri, explain how behavior affects individual reproduction, and ask questions about the population’s numbers and genetic variation.
Instruction
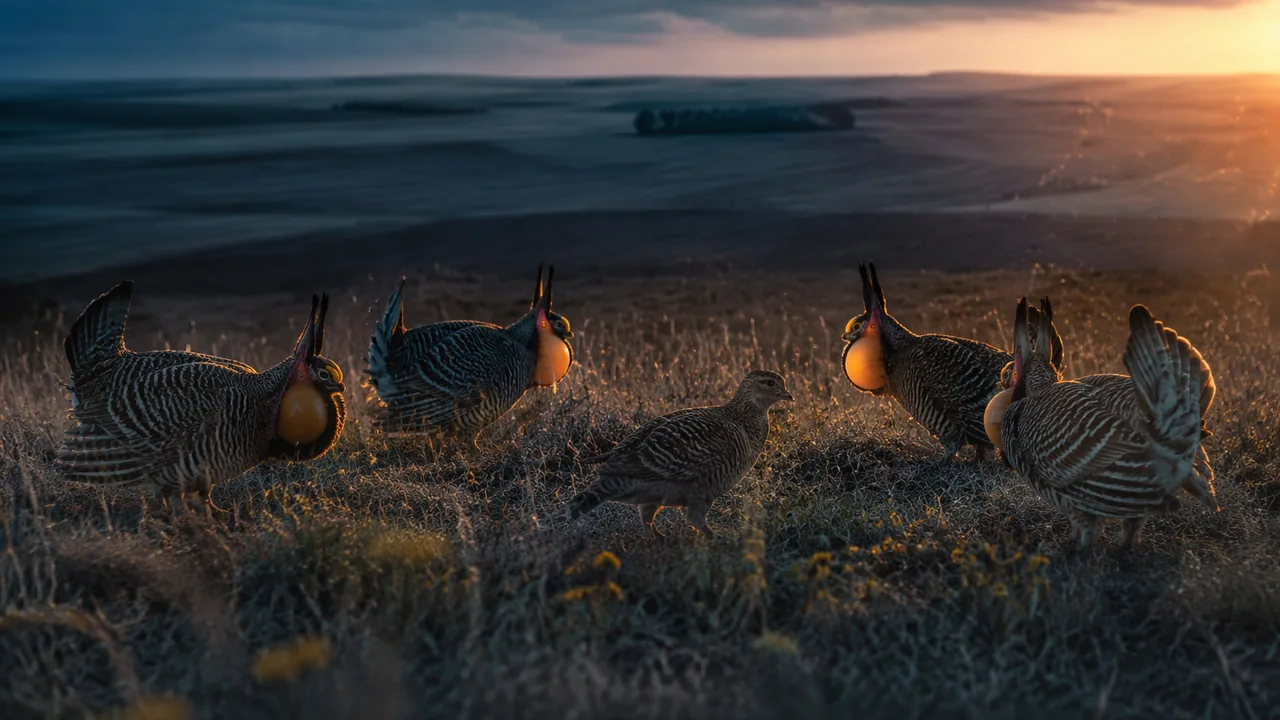
The phenomenon. Before dawn on a spring morning on a hilltop prairie in Harrison County, in far northwest Missouri, a low “oooomph, oooomph” carries through the dark. Male greater prairie-chickens have gathered on a booming ground, or lek: they inflate orange air sacs on their necks, raise feather tufts like horns, stamp their feet, call and fight. Hens walk through the lek, watch, and mate with the male they choose. It is one of the oldest spectacles of the Missouri prairie, and it is close to ending. The Missouri Department of Conservation (MDC) reports that prairie-chickens numbered in the hundreds of thousands across Missouri’s prairies as the 1800s began, that wartime estimates in the 1940s ranged from 5,000 to 13,000 birds, that there were about 1,000 by 1998 and 200 by 2006, and that fewer than 25 birds now remain in isolated flocks in northwest and west-central Missouri. The main cause is habitat loss: less than one-tenth of one percent of Missouri’s original prairie remains. MDC has tried to rebuild flocks by trapping birds where they are still common and releasing them here: from Kansas to Wah’Kon-Tah Prairie (2008–2012) and from Nebraska to Dunn Ranch (2013–2017). Our question for the unit: how do behavior and population size shape a species’ survival, and what does a crash in numbers leave behind in its genes?
How fast is that decline? Use MDC’s figures of about 1,000 birds in 1998 and 200 in 2006. The per-capita rate is r = ln(200/1,000) ÷ 8 = ln 0.2 ÷ 8 ≈ −0.20 per year, so the population was halving about every ln 2 ÷ 0.20 ≈ 3.5 years. The number is only as good as the estimates, and MDC’s own publications give different figures for some years, but it shows how quickly a small population in poor habitat can fall. The same equation that describes growth describes decline; only the sign of r changes.
Behavior on the booming ground. On a lek, males compete for small display territories, and their contests sort them into a ranking. Hens visit and, in MDC’s words, select the most fit mate, so mating is far from equal: the Illinois Natural History Survey reports that typically only 10–30 percent of male greater prairie-chickens get to mate. Gathering on a lek has costs as well as benefits. A lek is loud and visible to hawks and other predators, but it lets hens compare many males in one place, and many eyes watch for danger. enrichment asks you to evaluate evidence about how group behavior affects individuals’ and species’ chances to survive and reproduce. The lek is one case; you will compare others.
Behavior and genes. Two features of this story affect genetic variation. First, the population passed through a bottleneck: the birds left carry only the alleles their few ancestors happened to have. Next door in Illinois, where the record is longest, prairie-chickens fell from about 2,000 birds in 1962 to fewer than 50 by 1994; over the same years both the fertility and hatching rates of their eggs and their genetic diversity fell, and translocated birds from large, genetically diverse populations restored egg viability. Second, when only a few males mate each season, fewer individuals pass on their genes each generation, which makes chance losses of alleles more likely. Later in the unit you will measure both effects with a model.
Asking questions. Why do prairie-chickens boom? is a start. What fraction of the males on a Missouri lek mated with at least one hen this spring? is testable with genetic paternity tests, and researchers in Illinois are doing exactly that.
📖 Read for this lesson
The reading opens over the lesson; close it to come back to exactly where you were. The checks below draw on it.
Formative check
Work through these before moving on. They are not graded — they tell you whether the standard below has landed yet.
On a lek, only a minority of males mate each spring. What do you predict about genetic variation in the next generation, compared with a population where many males father chicks?
Which behavior decides which male prairie-chickens mate?
A population declining at r = −0.20 per year halves about every years (use ln 2 ≈ 0.693).
Make a timeline of the greater prairie-chicken in Missouri from 1800 to today, marking prairie loss, the end of hunting, the decline, and the translocations from Kansas and Nebraska. Then write two testable questions about their behavior or genetics.
How confident are you that you can describe how prairie-chicken lek behavior affects which individuals reproduce, and how and why the Missouri population declined?
Practice
Work these on paper or in your notebook, then open Check your answer. Aim for all of Fluency and Application; try at least one Challenge.
Printable version: this unit’s practice workbook (PDF)
Fluency
Build speed and accuracy with the core skill.
- A population of 50 grows exponentially with a per-capita rate of 0.05 per year (continuous). Estimate its size after 3 years.
Check your answer
Answer: ≈ 58N = N0ert. - A population of 1000 grows exponentially with a per-capita rate of 0.2 per year (continuous). Estimate its size after 8 years.
Check your answer
Answer: ≈ 4,953N = N0ert. - Define a population bottleneck and give the Missouri example from this unit.
Check your answer
Answer: A sharp reduction in population size that leaves only a few individuals’ alleles; the greater prairie-chicken, reduced by prairie loss from hundreds of thousands in Missouri to fewer than 25 birds today.The remaining birds descend from the survivors and carry only their alleles.
Application
Use the skill in context. Show your reasoning.
- MDC estimated about 1,000 prairie-chickens in Missouri in 1998 and about 200 in 2006. Estimate r and the halving time.
Check your answer
Answer: r ≈ −0.20 per year; halving time ≈ 3.4 yearsr = ln(200/1,000) ÷ 8 = −1.61 ÷ 8 = −0.201; 0.693 ÷ 0.201 = 3.4 years. - MDC’s estimate for the 1940s ranges from 5,000 to 13,000 birds. Estimate r from 1944 to 1998 (about 1,000 birds) using each end of the range. How sensitive is r to the starting figure, and how does either rate compare with 1998-2006?
Check your answer
Answer: r ≈ −0.047 per year from 13,000 (halving about every 15 years) and ≈ −0.030 from 5,000 (about every 23 years). The starting figure changes r by more than a third, but either way the decline after 1998 (−0.20) was four to seven times faster.ln(1,000/13,000) = −2.565, ÷ 54 = −0.0475; ln(1,000/5,000) = −1.609, ÷ 54 = −0.0298; 0.693 ÷ 0.0475 = 14.6; 0.693 ÷ 0.0298 = 23.3. - In an illustrative spring, 60 hens mate on leks attended by 50 males; 10 top-ranked males mate with 48 of the hens and the other 40 males share the remaining 12. Compare the average number of matings per top male and per other male.
Check your answer
Answer: 4.8 matings per top male; 0.3 per other male48 ÷ 10 = 4.8; 12 ÷ 40 = 0.3.
Challenge
Stretch problems. Expect to think before you write.
- Using the previous problem, explain how the prairie-chicken lek mating system affects both natural selection on males and the loss of genetic variation.
Check your answer
Answer: Because a few males win most matings, any heritable trait that helps a male win contests or attract hens (display, vigor, condition) is strongly favored, so selection on males is intense. At the same time, only a few males’ alleles pass to the next generation, so the effective population size is small and variation is lost faster by drift.Unequal reproductive success strengthens selection and reduces effective population size.
Review
Keep earlier skills sharp.
- Producers in an ecosystem capture 50,000 kJ of energy. Using the 10% rule, about how much energy reaches the tertiary consumers?
Check your answer
Answer: ≈ 50 kJAbout 10% of the energy at one level is passed to the next; the rest is used or lost as heat.
From Hundreds of Thousands to Fewer Than Twenty-Five: Missouri’s Prairie-Chickens on Record
Missouri Department of Conservation, Field Guide: Greater Prairie-Chicken (reviewed Dec. 9, 2025) and news releases of Aug. 30, 2011, May 3, 2012, Apr. 16 and July 29, 2015, Apr. 22, 2016, Mar. 18 and Apr. 25, 2019; Missouri Conservationist, Mar. 1998, Feb. 2004 and Mar. 2008; Westemeier et al., Science 282:1695-1698 (1998), abstract; Bouzat et al., American Naturalist 152:1-6 (1998), abstract; Westemeier and Simpson (1991) via Conservation Evidence; Illinois Natural History Survey (Dec. 21, 2015); University of Illinois News Bureau (Feb. 27, 2017); Mussmann et al., Royal Society Open Science 4:160736 (2017), CC BY 4.0; retrieved Nov. 5, 2026 · SLS original, citing Missouri Department of Conservation and University of Illinois publications and quoting short passages with attribution; figures from Mussmann et al. (2017) used under CC BY 4.0
Why this reading. Your timeline, your decline model and your rescue report all need published figures with sources, and the task tells you to label every number as published or illustrative. Here are the published ones: the Missouri Department of Conservation’s (MDC) estimates of the state’s prairie-chickens from the 1800s to today, its counts on the spring leks and its record of birds moved in from Kansas and Nebraska, and the genetic record from neighboring Illinois, where scientists have measured what a crash does to a prairie-chicken population’s genes and eggs. MDC’s own publications do not always agree; this reading shows where, so you can say which figure you are using.
1. The decline, as MDC states it
| Date | Missouri prairie-chickens | Source |
|---|---|---|
| As the 1800s began | “in the hundreds of thousands across open prairies” | MDC news release, Mar. 18, 2019 |
| 1907 | Hunting stopped, with about 12,500 birds left in the state | Missouri Conservationist, Feb. 2004 |
| 1944 (World War II era) | Estimates “ranged only from 5,000 to 13,000 birds in scattered flocks”; biologist Charles Schwartz estimated 13,000 | MDC, Mar. 18, 2019; Missouri Conservationist, Feb. 2004 |
| 1998 | About 1,000 birds | MDC, Mar. 18, 2019 |
| 2006 | About 200 birds | MDC, Mar. 18, 2019 |
| Spring 2011 | “about 100 prairie chickens sighted on mating grounds” | MDC news release, Aug. 30, 2011 |
| Spring 2019 | “less than 50 birds confirmed this spring in two isolated populations” | MDC news release, Apr. 25, 2019 |
| Today | “Fewer than 25 birds remain in isolated populations in northwest and west-central Missouri” | MDC Field Guide, Greater Prairie-Chicken (reviewed Dec. 9, 2025) |
Where MDC’s figures disagree. A March 1998 Missouri Conservationist article put the population “at only 2,000 birds,” while MDC’s 2019 release gives about 1,000 for 1998. A February 2004 article said “only about 500” remained and a March 2008 article said “fewer than 500,” while the 2019 release gives 200 for 2006. Prairie-chickens are counted mainly as males booming on leks, so every total is an estimate. The table uses the 2019 release because it gives one consistent series; in your report, say which figure you use and where it came from.
Why they declined. MDC’s field guide names the cause: “Loss of suitable habitat from agricultural conversion and nonnative grass establishment and grazing.” MDC’s 2019 releases report that less than one-tenth of one percent of Missouri’s original native prairie remains and that biologists estimate a core of at least 10,000 acres is needed to sustain a flock; its 2011 release adds that adults live only two to three years on average, so a few bad nesting seasons in a row can empty a lek.
2. The leks and the translocations
- Upper Osage Grasslands (west-central Missouri). The flock at Wah’Kon-Tah Prairie near El Dorado Springs “vanished by 2004,” while a small flock survived about 10 miles away at Taberville Prairie. From 2008 to 2012 MDC trapped birds in the Smoky Hills of Kansas, where they are plentiful, and released them at Wah’Kon-Tah with leg bands and radio transmitters (MDC, May 3, 2012). In summer 2011 crews found 29 nests at Wah’Kon-Tah and Taberville; hens in 23 of them hatched broods, “almost 80 percent,” against about 50 percent in most stable populations (MDC, Aug. 30, 2011). In spring 2012 the birds used three leks. By 2018 biologists counted six males on the lek at Taberville and only two birds on a lek at Wah’Kon-Tah; in 2019, four males and three hens at Taberville, and MDC reported that the birds “have failed to establish a sustained population at Wah’Kon-Tah.”
- Grand River Grasslands (Harrison County, northwest Missouri). The flock at The Nature Conservancy’s Dunn Ranch and MDC’s Pawnee Prairie fell to three males on leks in 2012 after extreme nesting-season weather. MDC released birds trapped in Nebraska from 2013 to 2017: 19 males and 20 hens in 2015, and in 2016, 100 birds trapped in Nebraska, of which 60 were released at Dunn Ranch and 40 in neighboring Iowa. Spring lek counts: 40 birds on five leks (2015), 47 birds on seven leks (2016), 33 birds in 2018 and again in 2019 (16 males and 8 hens on the Dunn Ranch lek, 6 males and 3 hens on a lek on private land).
3. Who mates on a lek
MDC’s field guide describes the system: “Cocks visit booming grounds (leks), where they dance, call, and fight among themselves. Hens visit the lek and select the most fit mate; mating occurs on the lek.” The breeding season runs from March through mid-April, and chicks stay with the hen for 8–10 weeks. Charles Schwartz, MDC’s first prairie-chicken biologist, found that a booming ground averages about 12 males, and some were used for 40 years (Missouri Conservationist, Feb. 2004). The Illinois Natural History Survey (Dec. 21, 2015) reports that “typically only 10-30% of male Greater Prairie-Chickens get to mate,” so the number of birds that pass on genes each year is much smaller than the number on the leks. That gap is what the term effective population size is for; a 2017 genetic study of Illinois leks estimated an effective size per lek averaging 15.9 birds.
4. What the crash did to the genes: the Illinois record
Missouri’s flocks have not been studied genetically in the same depth, but the population across the state line in Illinois has, and it is the standard example.
- Numbers and eggs fell together. Westemeier and colleagues (Science, 1998) followed one remnant population for 35 years: it “decreased from 2000 individuals in 1962 to fewer than 50 by 1994. Concurrently, both fitness, as measured by fertility and hatching rates of eggs, and genetic diversity declined significantly.”
- Alleles were lost. DNA from Illinois museum specimens (Bouzat and colleagues, American Naturalist, 1998) revealed “the loss of specific alleles (known to have been present earlier in this century) following a demographic contraction,” including alleles found in every other population sampled.
- Outside genes helped the eggs. In a small 1991 test, eggs were swapped between nests in two isolated Illinois flocks: 20 of 24 exchanged eggs hatched (83 percent), against 45 percent of 112 eggs that were not exchanged (Westemeier and Simpson 1991, summarized by Conservation Evidence).
- Translocation. Between 1992 and 1998 “teams imported more than 200 prairie chickens from other states,” from North Dakota, Minnesota, Kansas and Nebraska (University of Illinois, Feb. 27, 2017), and the 1998 study reports that translocations from “large, genetically diverse populations restored egg viability.”
- What came back, and what did not last. Mussmann and colleagues (Royal Society Open Science, 2017, CC BY 4.0) compared six DNA markers before and after the translocations. Average allelic richness (the number of alleles per gene, corrected for sample size) rose from 4.7 before to 5.5 after, a significant gain; observed heterozygosity changed little (0.525 to 0.611, not significant). That is the textbook pattern: a short bottleneck removes rare alleles first and heterozygosity more slowly. Twenty years on, the males counted on the leks of the two remaining counties fell from 63 (2010) to 46, 33 and 27 (2013), and the authors conclude that without enough habitat the birds depend on repeated translocations.
5. Worked calculations
- The lesson’s rate. About 1,000 birds in 1998 to 200 in 2006: r = ln(200 ÷ 1,000) ÷ 8 = −1.609 ÷ 8 = −0.20 per year; halving time 0.693 ÷ 0.201 = 3.4 years (3.5 if you round r to 0.20 first).
- The slower decline before. 13,000 (1944) to 1,000 (1998): r = ln(1,000 ÷ 13,000) ÷ 54 = −0.047 per year, halving every 14.6 years. From the low end of the wartime range, 5,000: r = −0.030, halving every 23 years. The decline sped up as the flocks shrank.
- Projection against the record. If the 1998–2006 rate had simply continued, 200 × e−0.201 × 13 ≈ 15 birds would have been left by 2019. MDC confirmed more than that in 2019 (33 birds in the Grand River Grasslands alone) because birds from Kansas and Nebraska had been added; a model of a managed population has to include the birds people move.
- The Illinois lek count. 63 males (2010) to 27 (2013): 27 ÷ 63 = 0.43 of the males left after three years, r = ln(0.43) ÷ 3 = −0.28 per year.
- Allelic richness. (5.5 − 4.7) ÷ 4.7 = 0.17: a 17 percent gain in alleles per gene after translocation.
- Heterozygosity kept by drift. With N = 20 breeders, 1 − 1 ÷ (2 × 20) = 0.975 per generation; after ten generations 0.97510 = 0.78.
6. A timeline you can source
| Date | Event | Source |
|---|---|---|
| Early 1800s | Hundreds of thousands of prairie-chickens on Missouri’s prairies | MDC 2019 |
| 1907 | Hunting stopped (about 12,500 birds) | Missouri Conservationist 2004 |
| 1944 | About 13,000 birds (estimates 5,000–13,000) | MDC 2019; Missouri Conservationist 2004 |
| 1962–1994 | Illinois remnant falls from 2,000 to fewer than 50; eggs and genetic diversity decline | Westemeier et al. 1998 |
| 1992–1998 | More than 200 birds moved into Illinois from other states | University of Illinois 2017 |
| 1998 | About 1,000 birds in Missouri | MDC 2019 |
| 2004 | Wah’Kon-Tah flock vanishes | MDC 2012 |
| 2006 | About 200 birds | MDC 2019 |
| 2008–2012 | Kansas birds released at Wah’Kon-Tah | MDC 2011, 2012 |
| 2012 | Three males left on Grand River leks | MDC 2019 |
| 2013–2017 | Nebraska birds released at Dunn Ranch | MDC 2015, 2016, 2019 |
| 2019 | Fewer than 50 birds confirmed in two isolated populations | MDC 2019 |
| Today | Fewer than 25 birds remain | MDC Field Guide (reviewed 2025) |
Sources: Missouri Department of Conservation, Field Guide: Greater Prairie-Chicken (reviewed 2025-12-09) (mdc.mo.gov); MDC, MDC finding fewer endangered prairie chickens despite conservation efforts (Mar. 18, 2019) (mdc.mo.gov); MDC, MDC finds endangered prairie-chicken numbers low on spring mating grounds (Apr. 25, 2019) (mdc.mo.gov); MDC, Weather gives endangered prairie chickens a nesting boost (Aug. 30, 2011) (mdc.mo.gov); MDC, New hope arrives for endangered prairie chickens (May 3, 2012) (mdc.mo.gov); MDC, MDC tracking Grand River Grassland prairie chickens (Apr. 16, 2015) (mdc.mo.gov); MDC, MDC biologists manage habitat to help prairie chickens through wet weather (July 29, 2015) (mdc.mo.gov); MDC, MDC finds prairie chicken numbers up at Dunn Ranch (Apr. 22, 2016) (mdc.mo.gov); Missouri Conservationist, Bringing the Boom Back to Missouri (Mar. 1998) (mdc.mo.gov); Missouri Conservationist, Save the Last Dance (Feb. 2004) (mdc.mo.gov); Missouri Conservationist, Spirit of the Prairie (Mar. 2008) (mdc.mo.gov); Westemeier, R. L., et al., Tracking the long-term decline and recovery of an isolated population, Science 282 (1998), abstract (PubMed 9831558) (pubmed.ncbi.nlm.nih.gov); Bouzat, J. L., et al., The ghost of genetic diversity past: historical DNA analysis of the greater prairie chicken, American Naturalist (1998), abstract (PubMed 18811397) (pubmed.ncbi.nlm.nih.gov); Conservation Evidence, Successful exchange of prairie-chicken eggs between nests in two remnant populations (Westemeier and Simpson 1991) (conservationevidence.com); Illinois Natural History Survey, Ornithologist receives grant to determine ‘Who’s the father?’ for hatchling Greater Prairie-Chickens (Dec. 21, 2015) (blogs.illinois.edu); University of Illinois News Bureau, Greater prairie chickens cannot persist in Illinois without help, researchers report (Feb. 27, 2017) (news.illinois.edu); Mussmann, S. M., et al., Genetic rescue, the greater prairie chicken and the problem of conservation reliance in the Anthropocene, Royal Society Open Science 4:160736 (2017), CC BY 4.0 (ncbi.nlm.nih.gov)