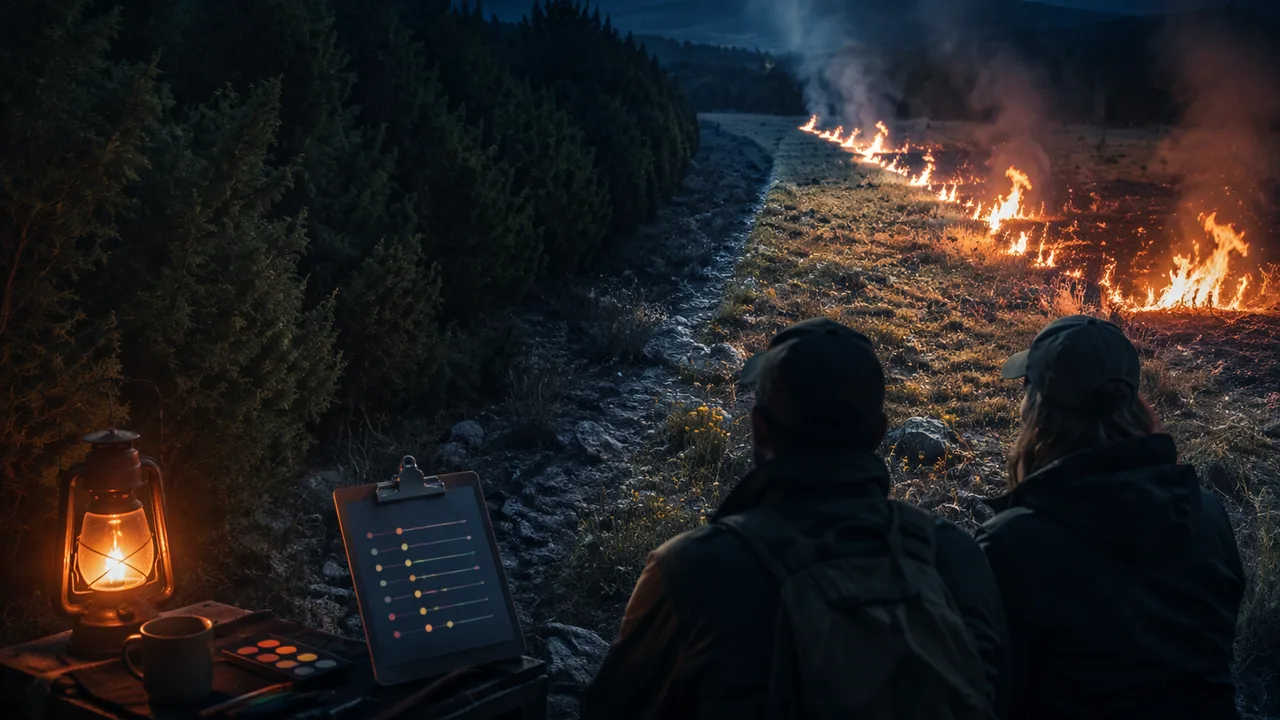
design, evaluate and defend a solution that reduces a human impact on a Missouri ecosystem, using criteria, constraints, test evidence and a weighted decision matrix.
Instruction
The challenge. Choose one ecosystem from this unit: an Ozark glade or woodland overgrown with eastern red cedar, the lower Missouri River and its pallid sturgeon, or a Missouri city creek that receives road salt, such as Hinkson Creek. Design a solution that reduces a human impact on its biodiversity, and defend it to a hypothetical panel of scientists, agency staff and community members.
The design cycle in your brief.
- Define the problem (9-12.ETS1.A.1). Describe the ecosystem, the human impact and the evidence for it. State prioritized criteria and constraints, including social and cultural ones: landowners and neighbors, farmers, river towns and barge operators, drivers who need safe winter roads, and tribal nations whose knowledge and rights are part of these places.
- Break it down (9-12.ETS1.A.2). Split the problem into at least two sub-problems, for example “remove the large cedars from a glade” and “keep new cedars from taking over again,” and say which one your design addresses.
- Compare solutions (9-12.ETS1.B.1). Score at least three candidate solutions against your criteria in a weighted decision matrix. Worked example (illustrative scores, 1-5): weights effectiveness 0.40, cost 0.20, habitat benefit 0.25, community support 0.15. Cutting cedars with chainsaw crews scores 4, 2, 4, 4: 0.40 × 4 + 0.20 × 2 + 0.25 × 4 + 0.15 × 4 = 3.60. Planting native glade seed scores 3, 2, 3, 4: total 2.95. A landscape-scale prescribed fire program scores 4, 3, 5, 2: total 3.75. The matrix favors prescribed fire slightly, but the low community-support score is a warning: neighbors may worry about smoke and about a fire escaping. A good brief discusses such trade-offs openly rather than hiding them behind a number.
- Test (9-12.ETS1.B.2, 9-12.LS4.C.3). Present evidence from your own test: the erosion prototype, a revised simulation run, the brine shrimp data, or a public dataset from USGS, the U.S. Fish and Wildlife Service, MDC or NOAA. State what the test shows and what it cannot show.
- Refine. Explain one change you made after testing and why.
Using ecological reasoning. Tie your design to what you learned about stability (9-12.LS2.C.1): will your solution help the ecosystem return to a stable state, or does it only treat a symptom? For a regime shift like a cedar thicket, a solution may need to push the system back past a threshold before it can hold itself there.
Presentation. Record a five-minute pitch of your design (video or audio) and end it by answering the question: which trade-off in your design was hardest to accept, and why did you accept it?
📖 Read for this lesson
The reading opens over the lesson; close it to come back to exactly where you were. The checks below draw on it.
Formative check
Work through these before moving on. They are not graded — they tell you whether the standard below has landed yet.
With weights 0.40, 0.20, 0.25 and 0.15, a design scored 4, 3, 5 and 2 has a weighted total of .
Two designs score within 0.1 of each other in your matrix. What should the brief do?
Missouri standard: 9-12.ESS3.C.2
Draft your problem statement: the ecosystem, the human impact, the evidence for it, and your top three criteria and constraints. Then name the solution you expect to evaluate and say what test result would show that it reduces the human impact and helps restore the ecosystem’s stability or biodiversity.
How confident are you that you can design and defend a solution that reduces a human impact on a Missouri ecosystem?
Unit 2 checkpoint
Do this before you start the task. It covers the whole unit and tells you what to review first.
A stable ecosystem is best described as one in which:
Why do many overgrown Ozark glades stay cedar thickets even after fire returns?
Removing a keystone species usually has only a small effect on a community.
To make 400 mL of a 35 ppt salt solution you need g of salt.
Which is the best explanation for the pallid sturgeon’s decline?
Which is a constraint?
With weights 0.5 and 0.5, an option scoring 4 and 2 has a weighted total of .
Breaking a complex environmental problem into smaller sub-problems makes it easier to design and test solutions.
What is the main value of running a simulation such as the Fire model before acting?
A treatment reduced soil loss from 500 g to 150 g, a reduction of %.
Why should a design brief for a Missouri ecosystem consider social and cultural effects?
Submit: Design Brief (1,000-1,400 words with decision matrix and test evidence) + five-minute recorded pitch
Task: Write a design brief that defines a human-impact problem in an Ozark glade or woodland, the Missouri River, or a Missouri creek that receives road salt; states prioritized criteria and constraints, including social and cultural ones; breaks the problem into sub-problems; compares at least three solutions in a weighted decision matrix; presents test evidence from a prototype, simulation or public dataset; and explains one refinement. Hand-drawn diagrams are fully acceptable.
Submission workflow
- Stage 1 — Plan. Problem statement, prioritized criteria and constraints, sub-problems, and three candidate solutions.
- Stage 2 — Reviewed draft. After a day’s break, review your own draft with this checklist: recheck the decision-matrix arithmetic, test whether each criterion is measurable, and identify one trade-off you have not addressed. If a family member or another reader is willing, ask them to apply the same checklist. Submit the checklist notes and your revision plan.
- Stage 3 — Final brief. 1,000-1,400 words with the revised matrix, test evidence, refinement and citations.
- Stage 4 — Pitch and defense. A five-minute recorded pitch (video or audio) that ends with your answer to the trade-off question in the lesson.
How it is scored
| Criterion | What proficient looks like |
|---|---|
| Problem definition (9-12.ETS1.A.1) | Criteria and constraints are specific, measurable where possible, prioritized, and include societal needs. |
| Decomposition (9-12.ETS1.A.2) | Breaks the problem into manageable sub-problems and targets one clearly. |
| Evaluation of trade-offs (9-12.ETS1.B.1) | Decision matrix is correct; trade-offs in cost, safety, reliability and social and cultural effects are discussed honestly. |
| Testing and simulation (9-12.LS4.C.3, 9-12.ETS1.B.2) | Presents test or simulation evidence, states its limits, and explains a refinement. |
| Ecological reasoning (9-12.LS2.C.2, 9-12.LS2.C.1) | Explains how the solution reduces the impact on biodiversity and whether it helps the ecosystem regain stability. |
| Evidence and communication (RST.9-10.1) | Claims tied to sources and data; the pitch answers the trade-off question accurately. |
From Open Glade to Cedar Thicket: The Ozark Fire and Lizard Record
Anderson, Juniperus virginiana, USDA Forest Service Fire Effects Information System (2003), citing Guyette and McGinnes 1982 and Martin and Crosby 1955; USDA NRCS Ecological Site Description R116BY024MO, Shallow Limestone Upland Glade/Woodland; MDC, Glades and Balds; NPS Ozark National Scenic Riverways, Fire Helps Collared Lizards and Wild Turkeys; Neuwald and Templeton, If You Burn It, They Will Come, Land 14:1696 (2025), abstract; retrieved Nov. 5, 2026 · Public domain (USDA Forest Service, USDA NRCS and National Park Service works); MDC and journal-abstract facts cited, with SLS summary tables
Why this reading. The lesson asks you to draw two food webs for an Ozark glade, one while fire still visited it every few years and one after eastern red cedar closed the canopy, with arrow thickness showing the strength of each interaction. You cannot weigh an arrow without a number. Here are the numbers: a fire-scar record from a Missouri glade, a Missouri burning test on cedars of different heights, the federal description of what a cedar-invaded glade looks like, and the forty-year record of collared lizards on Stegall Mountain in the Missouri Ozarks.
What a glade is
The Missouri Department of Conservation (MDC) describes glades, often called balds, as rocky openings in forest with exposed bedrock, native prairie grasses and wildflowers. They are most common in southern Missouri on south- and west-facing slopes, and they can be as small as a quarter acre or cover hundreds of acres. MDC notes that a healthy glade frequently has more than 100 species of plants, including pale purple coneflower, Missouri black-eyed Susan and Missouri evening primrose, and animals such as collared lizards, fence lizards, six-lined racerunners and roadrunners.
The fire record
Fire scars in tree rings date past fires. The Forest Service’s Fire Effects Information System (FEIS) summarizes two Missouri studies:
| Place and period | Mean interval between fires |
|---|---|
| A cedar glade in southern Missouri, 1630–1870 (Guyette and McGinnes 1982) | 3.2 years |
| The same glade after 1870 | 22 years |
| A post oak savanna in southern Missouri, 1700–1810 (Guyette and Cutter 1991) | 4.3 years; fire became less frequent after 1860, with European settlement |
Why fire controlled the cedars
FEIS states that eastern red cedar is easily killed by fire because of its thin bark, shallow roots, highly flammable foliage and its inability to sprout: it “does not sprout after complete cutting or burning.” Its seeds are spread by birds and small mammals, so seedlings appear near perches and fence lines. Size matters, though. In a Missouri cedar glade, spring burning killed all trees up to 0.5 m (1.5 feet) tall but only 7 percent of trees taller than 2 m (6.5 feet) (Martin and Crosby 1955). A Nebraska prescribed-fire study found the same pattern by height class:
| Cedar height | Killed by the burn |
|---|---|
| under 1 m | 88% |
| 1–2 m | 60% |
| 2–3 m | 35% |
| over 3 m | 10% |
A fire every three years or so meets every cedar while it is small. A fire every twenty-two years meets cedars that have had time to grow past the height fire can kill.
The cedar state
The Natural Resources Conservation Service describes Missouri’s shallow limestone glades as a set of states. The reference state is open grassland and scattered oaks with high plant and animal diversity. Prolonged fire suppression shifts the site, “generally over 20 years,” to a woody state dominated by eastern red cedar in which “canopy closures can approach 100% with little or no ground flora.” Getting back is not a matter of waiting: restoration “requires removing most of the eastern redcedar and other woody invaders, accompanied by prescribed fire.” MDC adds that many glades on private land are overgrown with cedar because of continuous livestock grazing and a lack of the periodic fire that once controlled cedar invasions, and it advises landowners to cut the cedars, let them cure for a year, and then burn.
FEIS explains why the cedar state holds itself in place: dense stands of large trees reduce the grass that serves as fine fuel, so fires that do start burn weakly or go out, and the big cedars survive them.
The lizard record from Stegall Mountain
| Year | What happened (NPS, Ozark National Scenic Riverways; Neuwald and Templeton 2025) |
|---|---|
| 1979 | Surveys on Stegall Mountain find no collared lizards; the glades are “too overgrown in trees, especially eastern red cedar.” |
| 1982 | Cedar removal and small prescribed fires begin on the glades. |
| 1984 | Collared lizards from a population about 40 miles away are released on restored glades. |
| 1984–1993 | The populations persist but do not colonize nearby glades, even glades separated only by bands of dense woods some 50 meters wide. |
| 1994 | The first landscape-sized burn: prescribed fire now covers the woodland between the glades, not just the glades. Lizards quickly colonize several nearby glades. In the burn units researchers record a 650 percent increase in grasshoppers, the lizards’ main food (and food for young wild turkeys). |
| 1999 onward | Landscape burns connect Stegall Mountain to three nearby mountains; all three are colonized, and marked lizards are seen dispersing from Stegall. |
| 2009 | The National Park Service, MDC and The Nature Conservancy complete over 5,000 acres of prescribed fire in the Stegall Mountain area. |
Weighing your arrows
- Fire → cedar seedlings. Before 1870: a fire every 3.2 years, killing every cedar under 0.5 m. After: a fire every 22 years, and a burn kills only 7 percent of cedars over 2 m. A thick arrow becomes a thin one.
- Cedar canopy → grasses and wildflowers (shading). Open glade: no arrow. Cedar state: canopy near 100 percent with little or no ground flora. The thickest arrow on the second page.
- Grasses → grasshoppers → collared lizards (food). Burned units held 7.5 times as many grasshoppers as before burning (a 650 percent increase). In the cedar state, both arrows nearly vanish, and so did the lizards.
- Grasses → fire (fuel). Not a feeding link, but a feedback: grass carries fire, fire keeps the glade grassy. Shade removes the grass, so the arrow back to fire disappears too.
Your turn
- Draw the two food webs. Beside each arrow, write the number from this reading that sets its thickness.
- Compute the factor by which the interval between fires lengthened after 1870 (22 ÷ 3.2 ≈ 6.9).
- Explain, using the 7 percent figure, why bringing fire back to a glade full of tall cedars does not by itself restore the glade.
- Write two testable questions the lizard record raises, each naming the measurement that would answer it.
Sources: Anderson, M. D. 2003. Juniperus virginiana. In: Fire Effects Information System, USDA Forest Service, Rocky Mountain Research Station (fs.usda.gov); USDA NRCS, Ecological Site Description R116BY024MO, Shallow Limestone Upland Glade/Woodland, state-and-transition model (edit.sc.egov.usda.gov); Missouri Department of Conservation, Glades and Balds (mdc.mo.gov); National Park Service, Ozark National Scenic Riverways, Fire Helps Collared Lizards and Wild Turkeys (nps.gov); Neuwald, J. L., and A. R. Templeton, If You Burn It, They Will Come: Collared Lizard Colonization of Ozark Mountains Under Prescribed Burns, Land 14(8):1696 (2025), abstract (cris.haifa.ac.il)
A River Rebuilt: The Pallid Sturgeon Record and the Evidence for Four Causes
USFWS, Revised Recovery Plan for the Pallid Sturgeon (Scaphirhynchus albus), first revision, signed January 2014; Federal Register 79 FR 12213 (Mar. 4, 2014); USFWS species profile, Pallid Sturgeon; retrieved Nov. 5, 2026 · Public domain (works of the U.S. Fish and Wildlife Service), with SLS evidence tables
Why this reading. The lesson asks you to weigh four explanations for the decline of the pallid sturgeon and to say which evidence led you to each criterion. It describes the evidence in words. Here are the numbers and dates behind the words, taken from the U.S. Fish and Wildlife Service’s 2014 recovery plan. Argue from the tables, not from the summary.
The fish
The pallid sturgeon lives in the Missouri and Mississippi rivers. The Fish and Wildlife Service describes a fish that can reach 6 feet and about 80 pounds and live at least 80 years. Males mature at about 5 to 10 years, females not until about 15 to 20, and females usually spawn only every two years. After hatching, the young drift downstream for days. The species was listed as endangered on September 6, 1990. It was not even described by scientists until 1905, so early numbers are unknown; some fishermen in the lower Missouri around 1905 reported about one sturgeon in five as a pallid.
How the river was rebuilt
| Year | Change (recovery plan, citing Funk and Robinson 1974 and others) |
|---|---|
| 1832 | Congress approves removing snags for navigation. |
| 1912 | A 6-foot navigation channel approved from Kansas City to the Mississippi near St. Louis. |
| 1944–1945 | The Flood Control Act of 1944 leads to six main-stem dams upstream; the Rivers and Harbors Act of 1945 deepens the channel to 9 feet and 300 feet wide from Sioux City, Iowa, to the mouth. |
| 1967 | A self-scouring navigation channel largely completed. |
| 1990 | Pallid sturgeon listed as endangered. |
| 1994 | Release of hatchery-reared pallid sturgeon begins in the lower river (annual since 2002). |
| by 2011 | About 3,443 acres (1,393 hectares) of shallow-water habitat built back in the lower river: side chutes, reconnected backwaters, new side channels. |
What is left, in numbers
- About 28 percent of the historical range was lost to the reservoirs behind the dams.
- Downstream of the reservoirs, channelization halved the river’s water surface area and doubled current velocity. Even in a stretch below Gavins Point Dam that was never channelized, total side-channel area fell 77 percent because of the dams upstream.
- Young sturgeon drift 245 to 530 km (152 to 329 miles) before they can feed on their own. Upstream of Lake Sakakawea, spawning happens but the drift runs out in the reservoir, and recruitment there “remains undetected.”
- Wild fish: about 45 were estimated above Fort Peck Reservoir in 1995; only 3 were caught there in 2007–2013. About 125 wild fish remain between Fort Peck Dam and Lake Sakakawea. In one 50-mile stretch of the lower Missouri, researchers estimated 5.4 to 8.9 wild and 28.6 to 32.3 hatchery-raised pallids per river kilometer.
- The plan’s judgment: stocking “appears to be successful in maintaining the species’ presence,” but “if supplementation efforts were to cease, the species would once again face local extirpation within several reaches.”
The evidence behind the four explanations
| Explanation | Evidence in the record | What weakens it as the only cause |
|---|---|---|
| Dams and reservoirs | Block migrations; release cold, clear water; trap sediment; cut the drift distance larvae need; 28 percent of the range now lake. | The lower Missouri, more than 800 miles with no dams, also lacks a self-sustaining population. |
| Channelization | Side channels, sandbars and shallow slow water lost; surface area halved; current doubled. | The upper river above Lake Sakakawea is not a channelized barge route, yet young fish there still fail to survive because the drift ends in a reservoir. |
| Harvest by mistaken identity | Pallid sturgeon were taken in commercial fishing for the look-alike shovelnose sturgeon; since 2010 shovelnose are protected where the two live together. | The plan judges current rules adequate for this threat, yet natural recruitment has not returned. |
| Invasive species, hybridization and water quality | Asian carps, which filter plankton, are expanding in the basin; pallids hybridize with shovelnose; contaminants are a concern, studied mostly in the shovelnose sturgeon as a stand-in. | The plan calls the significance of hybridization “poorly understood,” and few studies have measured what the carps do to sturgeon. |
From evidence to criteria
A criterion has to be measurable against something. “Help the sturgeon” is not a criterion; “detect wild-born young pallid sturgeon in a restored reach within ten years” is. The drift numbers suggest a sub-problem, enough river for larvae to finish drifting, that habitat building downstream cannot fix upstream. And the river’s other jobs set the constraints: the same channel carries barges, the levees protect farms and towns from floods, and the dams supply hydropower and water.
Your turn
- Using the midpoints of the two ranges (7.15 wild and 30.45 hatchery fish per kilometer), what percentage of the pallid sturgeon in that lower-river stretch were hatchery-raised? (30.45 ÷ 37.6 ≈ 81 percent.)
- For each of the four explanations, name one fact from this reading that supports it and one that complicates it.
- Write a problem statement for one sub-problem, three prioritized criteria and three constraints, and cite the row of this reading that led you to each.
Sources: USFWS, Revised Recovery Plan for the Pallid Sturgeon (Scaphirhynchus albus), first revision (2014), PDF hosted by the Pallid Sturgeon Recovery Program (pallidsturgeon.org); Federal Register, Final Revised Recovery Plan for the Pallid Sturgeon, 79 FR 12213 (Mar. 4, 2014) (federalregister.gov); USFWS, Pallid Sturgeon species profile (fws.gov)
Fire in Missouri: The Burning Gap, a Measured Mulch Test and the Tray Record
The Nature Conservancy and partners, Missouri Fire Needs Assessment (funded by the USDA Forest Service); Anderson, Juniperus virginiana, USDA Forest Service Fire Effects Information System (2003); Riechers et al., Effects of Three Mulch Treatments on Initial Postfire Erosion in North-Central Arizona, USDA Forest Service Gen. Tech. Rep. PSW-GTR-189 (2008); SLS illustrative tray record; retrieved Nov. 5, 2026 · Public domain (USDA Forest Service works); Missouri Fire Needs Assessment figures cited; SLS illustrative tray data and worked calculations
Why this reading. The lesson’s prototype test asks for percentage reductions and an evaluation against cost, effectiveness and ease of application on a steep burned slope. Three things were missing: the numbers behind Missouri’s changed fire regime, the complete tray record behind the 77 and 62 percent, and a real measurement from a real burned hillside to judge your trays against. All three are here.
1. What changed the fire regime: Missouri’s burning gap
The Missouri Fire Needs Assessment, prepared by The Nature Conservancy and partners with Forest Service funding, reports that most of Missouri’s fire-adapted ecosystems would historically have burned every 2 to 20 years, mostly from fires set by people, and that until about 100 years ago fire was used widely to manage the land. Since wildfire suppression began in the early 1900s, “forest canopies and midstories have closed, preventing light from reaching the forest floor,” and woody plants have taken over former prairies. The shortleaf pine woodlands of southeastern Missouri, once open with a diverse understory, are now crowded with species that shade out native grasses and wildflowers.
| Measure | Acres per year |
|---|---|
| Minimum prescribed fire needed statewide to replicate historical fire (2023 assessment) | 2,635,008 |
| Prairie systems alone burned per year before European settlement | over 2,000,000 |
| Estimated prescribed burning today | 125,000 to 150,000 |
Today’s burning is 125,000 ÷ 2,635,008 ≈ 4.7 percent to 150,000 ÷ 2,635,008 ≈ 5.7 percent of the minimum. One glade record shows the same change locally: fires every 3.2 years from 1630 to 1870, then every 22 years (Forest Service Fire Effects Information System, citing Guyette and McGinnes 1982). The assessment adds that prescribed burns decrease fuel loads, “minimizing the risk of wildfires” in forests and woodlands.
2. A measured field test: mulch on a burned slope
Forest Service researchers tested three mulches after the 2002 Indian Fire near Prescott, Arizona, on four small adjacent burned catchments of 0.34 to 0.48 hectares with slopes from under 10 percent at the bottom to 30–40 percent at the top. One catchment was left bare as a control; one was covered with wood chips from the fire-killed trees; one with compressed straw pellets; one with rice straw spread by hand at 4.5 Mg per hectare (2 tons per acre). A silt fence at the mouth of each caught the sediment, which was collected and weighed after each storm. Yields in megagrams (metric tons) per hectare:
| Treatment | Storm 1 (Jul. 30) | Storm 2 (Aug. 14) | Storm 3 (Sept. 14) |
|---|---|---|---|
| Bare control | 6.4 | 10.8 | 48.4 |
| Wood chips | 0.42 | 0 | more than 15.5 (fence partly failed) |
| Straw pellets | not yet installed | 2.2 | 28.2 |
| Rice straw | not yet installed | not yet installed | 9.1 |
| Storm rainfall (mm) | 9.2 | 9.1 | 61.0 |
| Peak 10-minute intensity (mm/h) | 22.9 | 38.1 | 117.3 |
Ground cover, measured in August and again in late October: the bare control was 58 percent bare ground in August and 38 percent in October as some plants returned; chips covered 81 percent then 58; pellets 62 then 27; straw 75 then 51.
Worked reductions, storm 3 (the only storm all four catchments saw): rice straw (48.4 − 9.1) ÷ 48.4 = 81 percent; pellets (48.4 − 28.2) ÷ 48.4 = 42 percent. In storm 2, pellets cut the yield by (10.8 − 2.2) ÷ 10.8 = 80 percent and chips by 100 percent; in storm 1, chips by (6.4 − 0.42) ÷ 6.4 = 93 percent. The authors’ reading: the big September storm, a ten-year event, moved straw into clumps and exposed bare ground between them, and the pellets had lost cover faster than the straw, which is why their protection fell from 80 to 42 percent. Cover on the ground when the storm hits is what does the work.
3. The tray record (illustrative)
Constructed teaching data, not measurements. Three trays packed with 2.0 kg of dry garden soil, propped at 20 degrees, 1 L poured from 30 cm in 30 seconds, runoff filtered and the filter dried overnight. Two storms each.
| Tray | Treatment | Storm 1 (g) | Storm 2 (g) | Total (g) | Reduction vs control |
|---|---|---|---|---|---|
| A | Bare control | 245 | 175 | 420 | — |
| B | Straw mulch (40 g, even layer) | 58 | 37 | 95 | (420 − 95) ÷ 420 = 77% |
| C | Two straw wattles | 95 | 65 | 160 | (420 − 160) ÷ 420 = 62% |
Every tray lost less in the second storm than the first: the loose surface soil went first, and what remained was packed and wetter. That is one way the trays behave like a real slope, and the Forest Service data show the opposite can happen when a bigger storm arrives.
4. Evaluating against criteria and constraints
| Criterion or constraint | Straw mulch | Wattles |
|---|---|---|
| Effectiveness (evidence above) | 77% in the trays; 81% in the field test at 4.5 Mg/ha, falling where cover clumps | 62% in the trays; barriers slow runoff and trap sediment but leave bare ground between them exposed to raindrops |
| Cost of material per square meter | Straw is cheap; the field rate of 4.5 Mg/ha is 0.45 kg/m2, but hand-spreading over hectares is labor | Fewer materials per m2 covered, but each wattle must be staked and trenched |
| Ease of application on a steep, burned slope | Can be spread by hand or dropped from the air; blows and clumps on steep ground | Heavy; must be placed on contour and pressed into soil by crews on foot |
| Side effects | Straw can carry weed seeds onto a slope that has just lost its plants; the field study used rice straw, and the lesson asks you to weigh the seed risk | Minimal seed risk; can fail if runoff undercuts the roll |
5. Two ways a tray is not a hillside
- Scale and storm: a tray gets 1 L in 30 seconds; the September storm dropped 61 mm at 117 mm/h on hectares of slope, and moved straw that had held through two smaller storms.
- Soil and ash: burned soils can form a water-repellent layer and carry ash that seals the surface; garden soil in a tray does neither, so the tray likely understates early runoff and overstates infiltration. Thin, rocky Ozark soils over bedrock would differ again.
Your turn
- Compute every percentage reduction above and confirm the 77, 62, 81 and 42.
- Rank straw and wattles against the three criteria in the table, then say which criterion the Forest Service data changed your mind about and why.
- Propose one change to the tray prototype that tests the clumping problem the field study found, and predict its effect.
Sources: Missouri Fire Needs Assessment (The Nature Conservancy and partners), home page (thenatureconservancy.github.io); Missouri Fire Needs Assessment, Historical Fire Regimes (thenatureconservancy.github.io); Missouri Fire Needs Assessment, Current Needs (thenatureconservancy.github.io); Anderson, M. D. 2003. Juniperus virginiana. In: Fire Effects Information System, USDA Forest Service (fs.usda.gov); Riechers, G. H., J. L. Beyers, P. R. Robichaud, K. Jennings, E. Kreutz and J. Moll, Effects of Three Mulch Treatments on Initial Postfire Erosion in North-Central Arizona, in USDA Forest Service Gen. Tech. Rep. PSW-GTR-189 (2008), pp. 107-113 (fs.usda.gov)