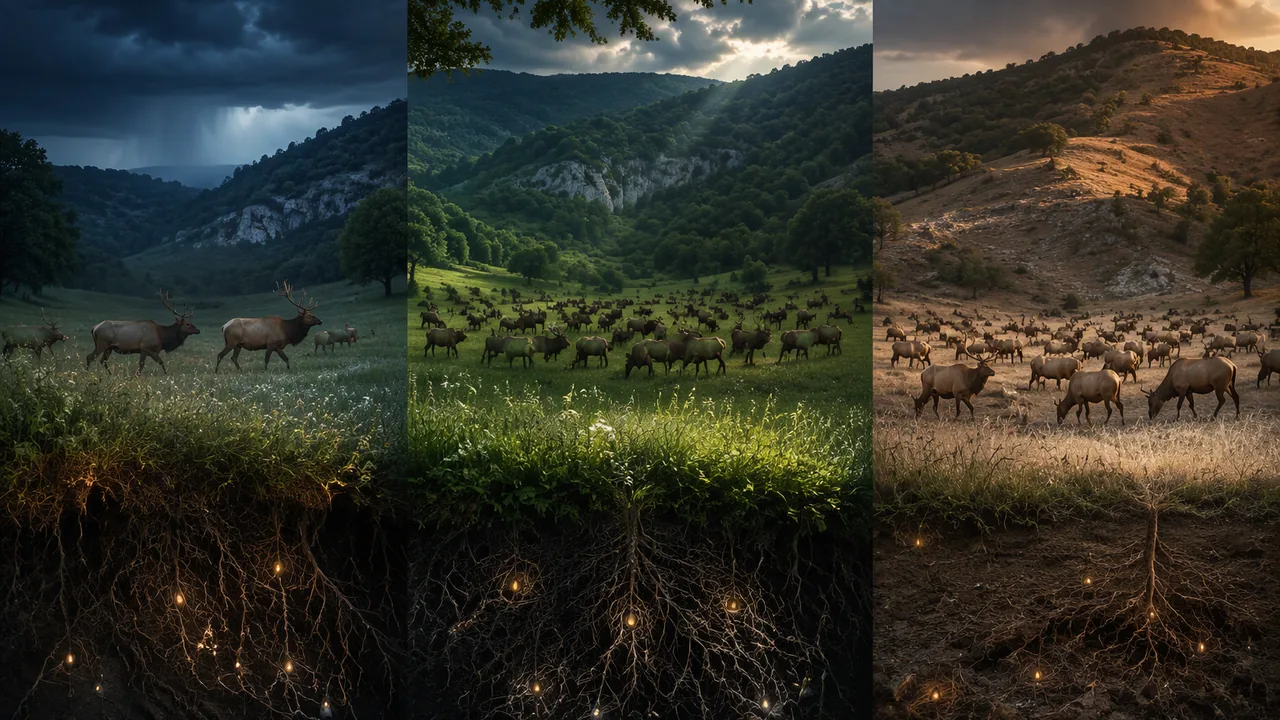
construct and defend a report, with mathematical models, that explains how carrying capacity, limiting factors and energy flow shaped the slow start, rapid growth and leveling-off of Missouri’s restored elk herd.
Instruction
The question. Why did the elk herd that Missouri restored to the Ozarks grow slowly at first, then by more than 10 percent a year, and then barely grow from 2024 to 2026, well short of the state’s goal of 400 to 500? You are writing for a hypothetical advisory board for the Elk Restoration Zone: people who care about the elk and the land, but who want the mathematics explained.
What a strong report contains.
- A growth model. Use the herd’s history (108 elk released from 2011 to 2013; about 125 in 2014, 175 in 2019, 207 in 2020, 241 in 2021, about 320 in 2024 and about 325 in 2026, all Missouri Department of Conservation estimates) to fit an exponential model to the growth phase and explain why the data cannot stay exponential. Sketch or fit a logistic curve and estimate a carrying capacity. Label every assumption, including that each number is an estimate, not a count.
- Limiting factors. Explain at least one density-dependent and one density-independent factor, and how a drought changes the carrying capacity. Use your duckweed results as evidence that resources set K.
- Energy. Use an energy pyramid calculation to show how much producer energy supports the herd, and connect it to the seed-heat lab: why do elk need so much grass?
- Biodiversity and the wider ecosystem. MDC says grazing elk help keep open spaces open. Explain how the herd’s grazing might affect plant diversity in the fields and glades it uses, using Simpson’s index or the quadrat method as the tool the board could use to find out.
- A management question. Propose one question the board should investigate, and name the data that would answer it. Do not recommend a policy that the evidence does not support.
A worked example of one link. Claim: the 2012 drought lowered the carrying capacity of the restoration area in the herd’s first years. Evidence: an MDC wildlife manager said in 2014 that the herd “was also hurt by a lack of food and water from the drought of 2012”; after 108 elk had been released, MDC’s estimate was still only about 125 in 2014, and calf survival in 2011-2014 was 0.45, against 0.67 in later years; in the duckweed lab, cups with fewer nutrients leveled off at 80 fronds instead of 200. Reasoning: carrying capacity depends on resources; drought reduced forage and water, so fewer calves survived and deaths nearly matched births. Every section of your report needs this structure.
Sensitivity and accuracy. People disagree about how many elk the Ozarks should hold: hunters, wildlife watchers and landowners whose fences and crops elk can damage all have a stake. Represent the facts accurately, cite sources for every number you did not measure, and keep your recommendation to what the evidence supports.
Presentation. In four minutes, live or recorded, present your model and answer one question about it.
📖 Read for this lesson
The reading opens over the lesson; close it to come back to exactly where you were. The checks below draw on it.
Formative check
Work through these before moving on. They are not graded — they tell you whether the standard below has landed yet.
If the herd grew exponentially from about 125 elk in 2014 to about 320 in 2024, the per-capita rate r is about:
A carrying capacity is a fixed number that does not change with the weather.
Write the management-question section of your report: the question, why the evidence raises it, and the data the board would need to answer it.
How confident are you that you can use mathematical models and lab evidence to explain what limits a real population?
Unit 1 checkpoint
Do this before you start the task. It covers the whole unit and tells you what to review first.
Which graph shape shows logistic growth?
With r = 0.4 and K = 500, a population of 100 grows by per year.
A drought can lower an ecosystem’s carrying capacity for a grazing species.
Which is a density-independent factor?
If producers store 50,000 kJ, about kJ reach the secondary consumers under the 10% rule.
Which statement about ecosystems is correct?
Decomposition in waterlogged, low-oxygen soil is usually faster than in well-drained soil.
Marking 40 animals and later catching 50, of which 8 are marked, gives an estimate of animals.
Two communities each have four species. Community X has 10 of each; community Y has 37, 1, 1 and 1. Which has the higher Simpson’s index?
In the duckweed lab, why use three cups per treatment?
A population with r = 0.094 per year doubles about every years.
Submit: What Limits the Ozark Elk? (900-1,300 words with a growth model and an energy calculation) + four-minute presentation
Task: Write a report for a hypothetical advisory board for Missouri’s Elk Restoration Zone that explains the slow start, rapid growth and recent leveling-off of the herd restored to the Ozarks from 2011 to 2013. Include a fitted growth model with a carrying-capacity estimate, at least one density-dependent and one density-independent factor, an energy pyramid calculation, a note on how the board could monitor plant diversity, and one management question with the data needed to answer it. Use evidence from the duckweed, seed-heat and sampling labs. Hand-drawn graphs are fully acceptable.
Submission workflow
- Stage 1 — Plan. Your draft growth graph with model, your energy calculation, and an outline linking each section to evidence.
- Stage 2 — Reviewed draft. Recompute your growth rate and energy figures a second time from the sources (or have a parent, guardian or other reader recompute them with you), check that every number has a source or is labeled illustrative, and mark unsupported claims; submit the review notes and your revision plan.
- Stage 3 — Final report. 900-1,300 words with revised displays, calculations, citations and a limitations paragraph.
- Stage 4 — Presentation and defense. Four minutes, live or recorded, answering one question about your model.
How it is scored
| Criterion | What proficient looks like |
|---|---|
| Growth model (9-12.LS2.A.1, SEP.5) | Fits an exponential or logistic model correctly, estimates K, and explains the model’s assumptions and limits. |
| Limiting factors (9-12.LS2.A.1, CCC.7) | Explains density-dependent and density-independent factors and how drought changes carrying capacity, with lab evidence. |
| Energy flow (9-12.LS2.B.2, CCC.5) | Energy pyramid calculation is correct and connected to why herbivores need large areas of producers. |
| Biodiversity (9-12.LS2.A.1) | Explains how grazing could affect plant diversity and how it could be measured. |
| Management question (SEP.6) | Proposes a question that follows from the evidence and names the data that would answer it. |
| Evidence and communication (RST.9-10.1) | Every number sourced or labeled illustrative; clear for a non-specialist; presentation answers a question accurately. |
Missouri’s Elk, 2011 to 2026: The Conservation Department’s Herd Estimates
Missouri Department of Conservation: Elk in Missouri fact sheet (2020); Missouri Elk Management Plan; Annual Reports 2013-2014 and 2014-2015; Missouri Deer Season Summary & Population Status Reports 2018, 2019 and 2020 (elk sections); Missouri Conservationist, Sept. 2020; MDC news releases (April 2024; spring 2026); MDC Field Guide, Elk; Jefferson City News Tribune, Nov. 30, 2014; retrieved November 5, 2026 · SLS original (summarizes and cites published Missouri Department of Conservation figures, with SLS worked calculations)
Why this reading. The lesson asks you to sketch the herd’s growth curve, and the performance task asks you to fit a model to it. Neither can be done from a single number. Here is every herd estimate the Missouri Department of Conservation (MDC) has published in the sources below, with where each one came from, the survival rates its researchers measured, and what MDC says limits the herd. Read it before you sketch anything, because the real curve has a shape the textbook S-curve only partly describes.
The release
Elk were gone from Missouri by the late 1800s; MDC’s elk management plan records the last one killed in 1886, in Texas County. Restoration began in the winter of 2010–2011. Over three winters elk were captured in southeastern Kentucky, tested for disease, quarantined and released on Peck Ranch Conservation Area in Shannon County: 35, 35 and 39 animals by the management plan’s count. MDC’s 2020 fact sheet gives the total as 108 and an earlier annual report as 111; the small difference does not change any conclusion below. The herd is managed to stay within Carter, Shannon and Reynolds counties, the Elk Restoration Zone, chosen for its public land, low road density and low row-crop acreage.
The herd estimates, 2014 to 2026
These are MDC’s estimates, built from GPS collars, aerial surveys, calf counts and a population model. They are not head counts, and the timing differs a little from year to year.
| Year | MDC estimate | Note | Source |
|---|---|---|---|
| 2011–2013 | 108 released | three winter releases | Elk in Missouri fact sheet (2020) |
| 2014 | about 125 | — | MDC Annual Report 2013–2014 |
| 2015 | 120–130 | “relatively stable” since the releases | MDC Annual Report 2014–2015 |
| 2019 | about 175 | adult elk | 2018 Deer Season Summary & Population Status Report; Elk Management Plan |
| 2020 (June) | 207 | not counting calves born that summer | Missouri Conservationist, Sept. 2020; 2019 status report |
| 2021 | 241 | not counting calves born in 2021 | 2020 status report |
| 2024 (spring) | about 320 | before calving | MDC news release, April 2024 |
| 2026 | about 325 | free-ranging elk | MDC news release, spring 2026 |
MDC’s population goal is 400 to 500 elk. In 2013 the Conservation Commission set three benchmarks before any hunt: about 200 elk, growth of 10 percent or more for three years in a row, and at least one bull for every four cows. They were met, and Missouri’s first elk hunt, five bull permits, was held in 2020; all five hunters took an elk. Five bull permits have been offered each year since; hunters took three bulls in 2025.
What the researchers measured
MDC, the University of Missouri and the University of Montana collared elk and followed them. Their survival and reproduction rates, as printed in MDC’s 2018 status report (the fraction of animals surviving a year, and the fraction of adult cows producing a calf):
| Rate | Missouri 2011–2014 | Missouri 2015 onward | Other eastern elk herds |
|---|---|---|---|
| Adult cow survival | 0.91 | 0.96 | 0.92 |
| Adult bull survival | 0.94 | 0.75 | 0.93 |
| Yearling cow survival | 0.82 | 0.89 | 0.91 |
| Yearling bull survival | 0.91 | 0.78 | 0.85 |
| Calf survival | 0.45 | 0.67 | 0.75 |
| Adult reproduction | 0.63 | 0.82 | 0.75 |
What MDC says limits the herd
- Drought, early on. In 2014 an MDC wildlife management coordinator told the Jefferson City News Tribune that the population “was also hurt by a lack of food and water from the drought of 2012,” and that young transplanted bulls bred less than mature ones would have.
- Brainworm. MDC’s fact sheet calls this parasite of white-tailed deer, which deer carry with little harm, “the leading cause of death in Missouri elk where the cause of death is known.” More than 40 percent of deer skulls examined in earlier Ozark work carried it.
- Predators. MDC’s field guide says a handful of elk have been killed by mountain lions since 2011; coyotes and bobcats can take newborn calves, and black bears may as their range grows.
- Hunting and the goal. MDC’s deer and elk program aims to keep herds “at or below the biological and social carrying capacity” of each management unit, with hunting as the main tool.
Worked calculations
- The lesson’s exponential estimate. If about 125 elk became about 320 in 10 years, r = ln(320 ÷ 125) ÷ 10 = ln 2.56 ÷ 10 = 0.940 ÷ 10 = 0.094 per year, a doubling time of 0.693 ÷ 0.094 = 7.4 years.
- Piece by piece. 2014 to 2019: ln(175 ÷ 125) ÷ 5 = 0.067 per year. 2019 to 2020: (207 − 175) ÷ 175 = 18 percent. 2020 to 2021: (241 − 207) ÷ 207 = 16 percent, above the 10 percent benchmark. 2021 to 2024: ln(320 ÷ 241) ÷ 3 = 0.095 per year. 2024 to 2026: ln(325 ÷ 320) ÷ 2 = 0.008 per year.
- If growth had not slowed. 325 × e0.094 × 10 = 325 × 2.56 ≈ 832 elk by 2036, far above the state’s goal.
- How much does the hunt remove? Five bulls out of 241 is 2.1 percent; out of 320, 1.6 percent. That is a real loss, but on its own it cannot turn growth of about 9.5 percent a year into less than 1 percent.
- The logistic check. With r = 0.4 and K = 500, a population of 250 grows by 0.4 × 250 × (1 − 0.5) = 50 per year.
Reading the curve honestly
Plot the table. You will see three phases. First, a slow start: for several years after release the herd hardly grew, in years when calf survival was 0.45 and only 63 percent of adult cows produced a calf, and when the 2012 drought cut food and water. Second, steady growth of roughly 9 to 18 percent a year from about 2015 to 2024, as calf survival rose to 0.67 and reproduction to 0.82. Third, a flat stretch: 320 in 2024, 325 in 2026. Two estimates are not a trend, and the 2024 and 2026 figures were not necessarily made at the same point in the year, so a report to a board should say that the leveling-off is suggested, not proven. But it is exactly what a logistic curve predicts near carrying capacity, and it raises the board’s real question: is the biological carrying capacity of the land the elk actually use lower than the state’s goal of 400 to 500?
Your turn
- Fit an exponential model to 2014–2024 and one to 2014–2019. Which describes the herd’s growth phase, and why do they differ?
- Estimate K from the table in two ways: the recent plateau (about 320–325) and the state’s goal (400–500). Which does the evidence support, and what data would settle it?
- Name one density-dependent and one density-independent factor from MDC’s explanations, and quote the sentence that supports each. Is brainworm, which depends on how many deer live nearby, dependent on the density of elk?
- Write one management question the record raises, and name the data (herd estimates, calf survival, forage, rainfall, harvest) needed to answer it.
Sources: MDC, Elk in Missouri (fact sheet, 2020) (huntfish.mdc.mo.gov); MDC, Missouri Elk Management Plan (mdc.mo.gov); MDC, Annual Report 2013-2014 (mdc.mo.gov); MDC, Annual Report 2014-2015 (mdc.mo.gov); MDC, 2018 Missouri Deer Season Summary & Population Status Report (Restoring Elk in Missouri) (mdc.mo.gov); MDC, 2019 Missouri Deer Season Summary & Population Status Report (Elk in Missouri) (mdc.mo.gov); MDC, 2020 Missouri Deer Season Summary & Population Status Report (Elk in Missouri) (mdc.mo.gov); Missouri Conservationist, Nature Lab (Sept. 2020) (mdc.mo.gov); MDC news release, MDC seeks public comments on future antlerless elk hunting season (April 2024) (mdc.mo.gov); MDC news release, Apply for MDC elk, bear hunting permits in May (2026) (mdc.mo.gov); MDC Field Guide, Elk (mdc.mo.gov); Jefferson City News Tribune, Missouri’s elk population is growing (Nov. 30, 2014) (newstribune.com)