4.08 Storm-Test Critique, Data Quality and Version 2
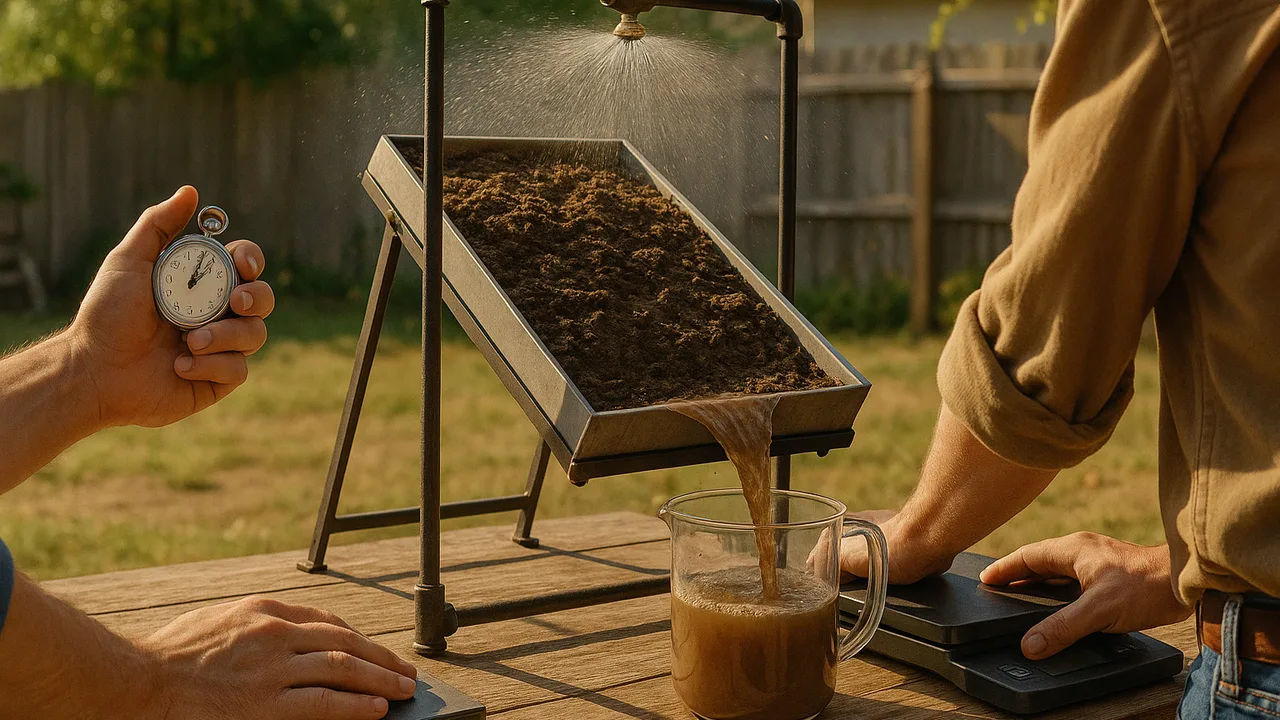
run the storm test, judge the accuracy and precision of our data and what they can tell us about a real slope, revise the test plan, and build an improved version 2 after peer critique.
- I can evaluate how accurate and precise my collected data is.
- I can judge whether my data can be used to infer how water affects processes in the natural world.
- I can revise my investigation plan to improve the accuracy and precision of my data if needed.
Phase 4: Build
Warm-Up ~5 min
Do Now. Reread your exit ticket from 4.07. Write the one change you would make to the storm itself so every tray gets the same rain.
A set of measurements can be very precise and still inaccurate.
Instruction ~10 min
The storm test. Each team runs three bare control trays and three trays with version 1. For each, pour 1.0 L of rain in 60 s, collect the runoff, measure its volume, then let the sediment settle, pour off the water, dry the sediment overnight and weigh it.
| Tray | Trial | Runoff (mL) | Dry sediment (g) | Notes |
|---|---|---|---|---|
| Bare control | 1 | |||
| Bare control | 2 | |||
| Bare control | 3 | |||
| Version 1 | 1 | |||
| Version 1 | 2 | |||
| Version 1 | 3 |
Gallery critique. Half of each team stays with its trays; the other half visits. Visitors use I like… I wonder… What if… on sticky notes, then the halves swap.
Worked example 1: precision and accuracy (sample data). Diego’s team got bare-control sediment of 118, 131 and 109 g (mean 119 g) and mulch version 1 of 41, 22 and 60 g (mean 41 g). The mean reduction, (119 − 41) / 119 ≈ 66%, meets the 60% criterion, but the mulch trials range over 38 g, almost as large as the mean: poor precision. The sticky notes said, “I wonder if the mulch was thicker in trial 2.” It was: the team never measured it. Also, in trial 1 they weighed the sediment damp, which adds water mass and makes the result too high, an accuracy problem.
Revising the plan. Version 2 of the plan fixed the method: 20 g of mulch spread evenly per tray, every storm poured from the class rain rack, every sample dried overnight. Version 2 of the design added a thin contour barrier across the steepest third. New mulch results: 24, 27 and 22 g (mean 24 g), a range of only 5 g and a reduction of (119 − 24) / 119 ≈ 80%.
Worked example 2: can a tray tell us about a real slope? The tray keeps the slope angle, the soil and the idea of a storm, so it fairly compares treatments. But it is only 40 cm long, the ‘storm’ is far more intense than most real rain, and a real burned slope has roots, rocks and water-repellent layers. The data support the claim “mulch reduced sediment loss compared with bare soil in our model”; they do not tell us the tonnes per hectare the real slope will lose. Say so in your report.
Iterate, do not restart. Change one or two things at a time and retest, so you know which change made the difference.
Guided Exercises ~15 min
Use your storm-test data and sticky notes.
Independent Practice ~10 min
Build and retest version 2.
Build version 2, run it three times with your revised plan, and record runoff and dry sediment. Write three sentences comparing version 1 and version 2 with means, ranges and percent reductions, and one limitation of the tray test.
🔎 Mini case study: Taking down two dams and letting a river carry sand again ~8 min
For about a century, two concrete dams on the Elwha River in Washington State trapped the sand and gravel the river had always carried to the sea. Below the dams the riverbed coarsened, and the beaches near the river mouth lost sediment. Salmon could no longer reach most of the river.
Beginning in 2011, both dams were removed in stages, the largest dam removal in the United States at the time. Engineers and scientists planned for the millions of cubic meters of sediment stored behind them: new water-treatment facilities were built in advance because the river would run muddy, and geologists measured the riverbed, the river mouth and the beaches before, during and after. As the river carried its stored sediment downstream, the delta at its mouth grew outward and nearby beaches gained sediment, and salmon returned to reaches above the old dams. The project showed how a single technology had changed the geosphere, hydrosphere and biosphere for decades, and how careful monitoring let people plan for the effects of undoing it.
Think about it: Which of the dams’ effects were unintended when they were built? How is the monitoring plan like your storm-test plan, and what does it say about measuring before and after a change?
Closure ~5 min
Version 2 and a better test plan are ready. Next phase we present the plan and our reading of the landscape to the district.
Exit ticket: which change, to the design or to the method, made the biggest difference, and what is your evidence?
How confident are you that you can I can judge the accuracy and precision of my data and revise an investigation plan to improve it.
Teacher notes
Materials: version 1 trays, rain rack or marked pouring height, graduated cylinders, collection cups, coffee filters, a balance, sticky notes, materials for the rebuild.
Setup: run the storms on day one and dry the sediment overnight; weigh, critique and rebuild the next day. Diego’s numbers are sample data. If time is short, run version 2 at the start of 4.09.
Listen for: “precise means accurate”; changing the method and the design at the same time without saying so; claims that the tray predicts real tonnages.
Support / stretch: give a mean-range-percent template. Stretch: compute the standard deviation of each set of trials and compare the two versions of the plan.