4.03 Running Water: A Stream-Table Investigation
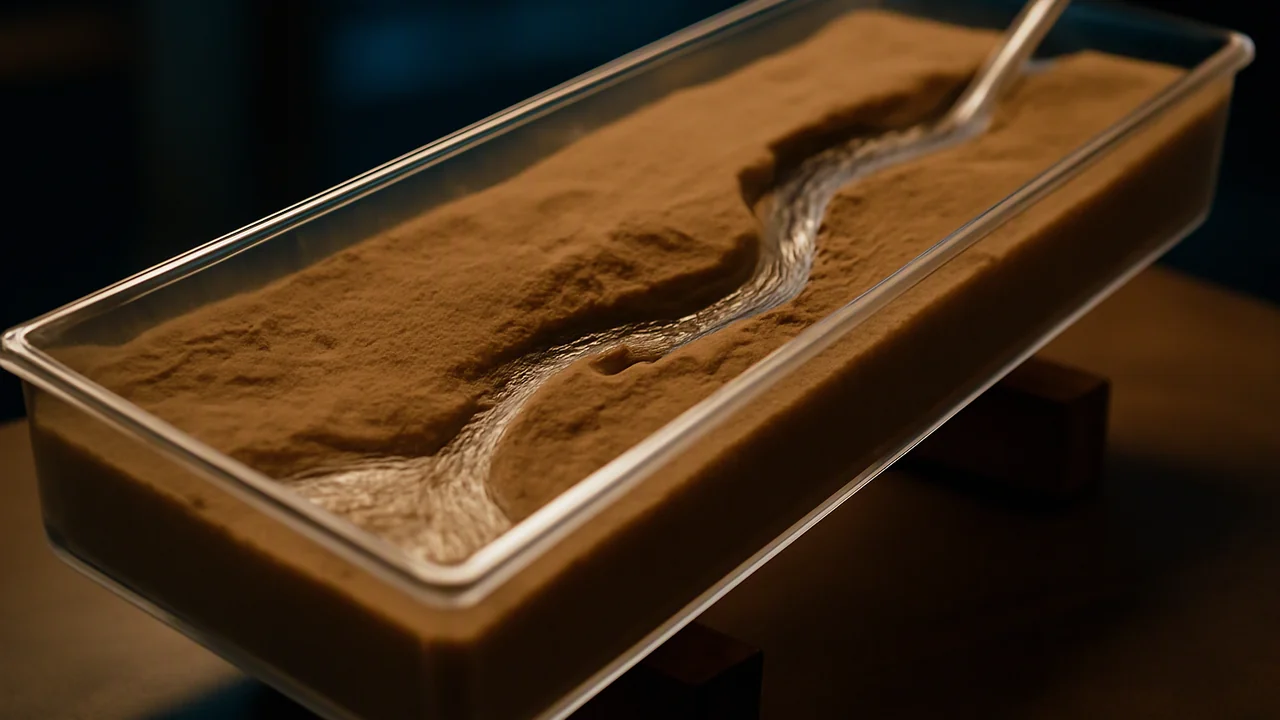
plan and carry out a controlled stream-table investigation of how slope affects erosion and deposition, and explain the results with the energy of flowing water.
- I can plan an investigation that includes collecting data about the heat capacity, density, and polarity of water.
- I can explain how the properties of water affect energy transfer, temperature patterns, air movement, and water movement at Earth’s surface.
- I can identify and plan to collect data showing the mechanical and chemical effects of water on Earth materials, such as erosion, weathering, and changes in rock.
- I can explain how the data I collect will help determine the effects of water on Earth materials and surface processes.
- I can include ways to measure or indicate the effects of water’s properties—such as heat capacity, flow, polarity, and density—on Earth’s materials or surface processes in my investigation plan.
Phase 2: Investigate
Warm-Up ~5 min
Do Now. After a heavy storm, a creek turns brown and loud, and a week later it runs clear and quiet. List two things that changed in the water and one thing it can do in the storm that it cannot do a week later.
A stream is 8 m wide and 0.5 m deep and flows at 0.75 m/s. What is its discharge?
Instruction ~10 min
The most important sculptor. Running water moves more sediment across the land surface than wind, ice or anything else. Every sand grain on a beach below a coastal mountain range was once carried by a river or torn from a cliff by waves. To investigate rivers, geologists measure how much water flows, how fast, and what it can carry. (Reading: Earle, Physical Geology, chapter 13.)
Worked example 1: discharge. A stream’s discharge Q is the volume of water passing a point each second: Q = cross-sectional area × average velocity. A channel 20 m wide and 1.5 m deep with water moving 1.2 m/s has Q = 20 × 1.5 × 1.2 = 36 m3/s. If each liter carries 500 mg of suspended sediment, the river carries 36,000 L/s × 0.5 g/L = 18 kg every second, or about 1,555 metric tons per day. Floods raise both the discharge and the sediment concentration, so most sediment moves in a few big storms each year.
Erosion, transport, deposition. Flowing water has kinetic energy, and its speed controls what it can do. Faster water erodes and carries larger grains; when water slows, it drops the largest grains first. Sand grains about 0.5 mm across are the easiest to pick up. Clay is smaller but harder to erode, because the tiny flat particles stick together; once lifted, though, clay stays suspended even in slow water. That is why muddy water stays muddy long after the current slows. Water slows where a stream enters a lake or the sea (building a delta), where a steep mountain canyon opens onto a flat desert basin (building an alluvial fan), and on the inside of every bend.
Worked example 2: slope and energy. Steeper streams flow faster, so they cut down into their beds and carry coarse gravel; gentle lowland rivers meander and deposit sand and mud. In the lab you change slope by raising one end of the tray. A rise of 5 cm over 100 cm is a 5% slope, and tan−1(0.05) ≈ 2.9°.
Planning a fair test. A good investigation changes one independent variable (slope), measures a dependent variable (mass of sediment moved, or the depth of the channel cut), and keeps everything else controlled: the same sand, the same starting shape, the same water volume and run time. Repeat each condition at least twice so you can judge precision. State whether you will work alone or in a group and who does each measurement. Write the plan first; then run it.
Lab: Stream Table: Slope, Erosion and Deposition. Question: how does the slope of a stream affect how much sediment it erodes and where it deposits it? Materials: a paint-roller tray or plastic box 60–100 cm long, about 3 L of lightly moistened play sand, a 2 L bottle with a small hole in the cap, blocks to raise one end (2, 5 and 10 cm), a bucket and a strainer or coffee filter, a ruler, a stopwatch, a kitchen balance, goggles.
- Write your plan: independent variable, dependent variable, at least three controlled variables, the number of trials, and whether you work individually or as a group.
- Pack moist sand into the upper two-thirds of the tray in an even layer 3 cm deep, leaving the lower end empty as a ‘lake’. Mark three points along the center line.
- Raise the upper end 2 cm. Let 2 L of water flow from the bottle for 60 seconds. Observe where the channel forms, where it bends and where sand is deposited.
- Measure the channel depth at the three points. Collect the sand deposited in the lake, drain it the same time each trial, and weigh it.
- Rebuild the bed to the same shape and repeat at 5 cm and 10 cm. Run each slope twice.
| Raise (cm) | Slope (%) | Trial | Channel depth at points 1–3 (mm) | Sand deposited in the lake (g) | Observations |
|---|---|---|---|---|---|
| 2 | 1 | ||||
| 2 | 2 | ||||
| 5 | 1 | ||||
| 5 | 2 | ||||
| 10 | 1 | ||||
| 10 | 2 |
Illustrative results (Option B, sample data). An 80 cm tray, 2 L over 60 s in every run. Sand deposited: 2 cm raise, 34 g and 38 g (shallow, winding channel; low fan); 5 cm raise, 96 g and 88 g (straighter, deeper channel; clear delta); 10 cm raise, 205 g and 221 g (deep straight gully; large delta, coarse sand dropped first at the lake edge). Channel depths: about 4 mm, 10 mm and 18 mm on average.
Why it matters. Dams on rivers trap sand that would have reached the beaches, and some beaches downstream of dammed rivers now need sand added by trucks and dredges. Understanding sediment transport is how engineers predict what a dam removal or a flood channel will do downstream.
Guided Exercises ~15 min
Use your stream-table data or the illustrative results.
Independent Practice ~10 min
Write up the lab in your Landscape Notebook.
Claim: how does slope affect erosion and deposition? Graph mean sand deposited against slope, use the graph and channel depths as evidence, and explain the result with the speed and energy of the water. Name the landform your lake deposit models, compare the two trials at each slope, and propose one improvement to the procedure (uneven packing, wet weighing, the flow slowing as the bottle empties).
Option C, a real river: open waterdata.usgs.gov, choose any streamgage, and record the highest and lowest daily mean discharge in the past year. Compute the ratio and explain what it means for the sediment the river can carry. Cite the station number and the date you looked.
Closure ~5 min
Steeper, faster water moves more sediment. Next class we ask what happens when the slope itself gives way.
How confident are you that you can I can plan and conduct an investigation of how running water erodes and deposits sediment.
Exit ticket: explain why a river drops gravel at a canyon mouth but carries mud all the way to a lake.
Teacher notes
Timing: Poly ran this lab over two 50-minute periods. Day 1: plan and the 2 cm and 5 cm runs; day 2: the 10 cm runs, graph and write-up.
Materials (per group): tray or box, play sand, 2 L bottle with a pierced cap, blocks, bucket, strainer or coffee filter, ruler, stopwatch, kitchen balance, towels, goggles.
Alternatives: Option A at home in a baking tray or bathtub; Option B, the illustrative results (sample data, not real measurements); Option C, a real USGS streamgage, with season rather than slope as the variable.
Listen for: changing two variables at once; “clay is easiest to move”; treating one trial as proof.
Support / stretch: give a plan template with the variable boxes. Stretch: compute the sediment carried by a 3 m3/s stream at 2,000 mg/L in a day.