4.02 Project Brief and Wonder Board: The Burned Slope Plan
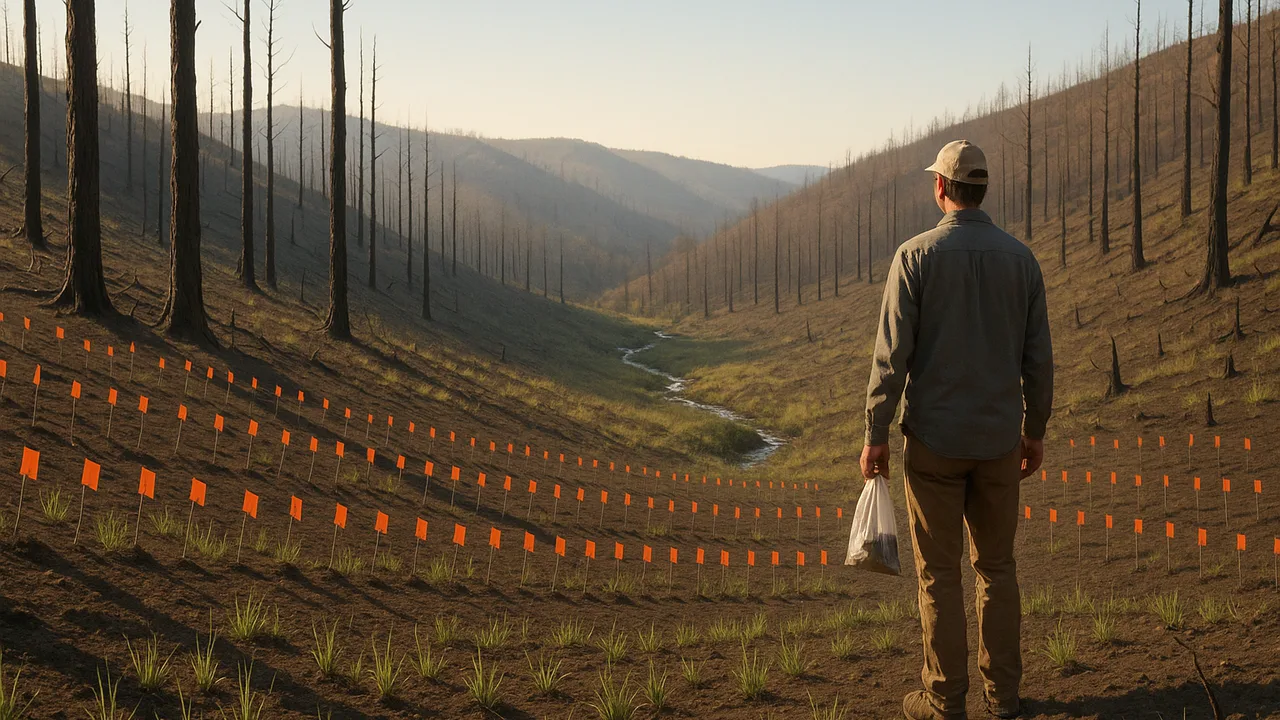
The Burned Slope Plan
How can we protect a creek and a road below a burned hillside through the rainy season, and explain, with evidence, how water and rock shaped this landscape and how one change to the surface ripples through Earth’s systems?
The mystery: After a wet winter a steep coastal hillside collapsed onto a highway and pushed new land into the sea, while in a glacier-carved valley inland, granite that crystallized kilometers underground sheds blocks from cliffs nearly a kilometer high every year.
Questions we will figure out together in this unit:
- Why do burned slopes send so much mud downhill?
- How fast does running water have to be to move sand or gravel?
- Why does a little water make sand stronger but a lot makes it collapse?
- How does water break solid rock?
- How long does it take for a burned slope to recover?
- Which protection works best: mulch, barriers or basins?
- How do we know if our measurements are accurate enough?
- How did the granite cliffs and the valley form in the first place?
define the conservation district’s burned-slope problem, organize data that show how a wildfire changed the hillside’s Earth systems, and sort our questions into need-to-knows.
- I can organize data that show how changes to Earth’s surface affect the hydrosphere, cryosphere, atmosphere, biosphere, or geosphere.
- I can describe what each data set shows about changes in Earth’s systems.
Phase 1: Spark
Warm-Up ~5 min
Do Now. Picture a steep hillside the week after a wildfire: black ground, bare soil, standing burned trunks. List everything that is different for a raindrop landing there compared with the same slope before the fire.
The same storm falls on a forested slope and on a freshly burned slope. Which sheds more runoff?
Instruction ~10 min
Meet the client. A county soil and water conservation district has asked our class for help. Last summer a wildfire burned a steep hillside above a creek and the mountain road that runs beside it. The rainy season starts in about two months. The district needs a slope and stream protection plan: a set of low-cost measures, tested on models, that reduces the soil and debris reaching the creek and the road, plus a clear explanation of how the landscape formed and why the burned slope is now at risk.
Driving question. How can we protect a creek and a road below a burned hillside through the rainy season, and explain, with evidence, how water and rock shaped this landscape and how one change to the surface ripples through Earth’s systems?
Our mission. Geoscientists, this unit you will investigate running water and failing slopes, model how water breaks down rock, design and test slope-protection measures in a storm test, and present a scientific reading of the landscape with your plan.
Organizing the evidence: Earth’s four spheres. A change to the surface rarely stays in one system. The district’s field notes (sample data, below) describe the slope before and after the fire. Your first job is to organize them by sphere: geosphere (rock and soil), hydrosphere (water), biosphere (living things) and atmosphere (air).
| Measurement (sample data) | Before fire | After fire | Sphere | What the change shows |
|---|---|---|---|---|
| Ground covered by plants and litter (%) | 85 | 10 | ||
| Water soaking into soil in a 10-minute test (mm) | 24 | 6 | ||
| Bare-ground surface temperature on a sunny afternoon (°C) | 31 | 48 | ||
| Loose soil and ash on the surface (mm deep) | 2 | 15 | ||
| Creek water cloudiness after a light shower (turbidity, NTU) | 5 | 140 | ||
| Birds counted in a 20-minute survey | 34 | 9 |
Worked example 1: what does one data set show? Infiltration fell from 24 mm to 6 mm, a 75% drop: (24 − 6) / 24 = 0.75. If the same 30 mm of rain falls, before the fire about 6 mm runs off; after the fire about 24 mm runs off, four times as much. That is a hydrosphere change caused by a biosphere and geosphere change.
Worked example 2: a data set that crosses spheres. Turbidity in the creek rose from 5 to 140 NTU, 28 times higher, after only a light shower. It is measured in the hydrosphere, but it carries geosphere material (soil and ash) loosened by the loss of the biosphere’s plant cover. Organizing data by sphere makes these links visible.
Teams and roles. Teams of four rotate roles each week: Lead Geologist (keeps the team on the driving question), Data Analyst (measurements, graphs and uncertainty), Field Engineer (builds and tests the measures) and Public Communicator (writes for the district and presents).
Guided Exercises ~15 min
Use the sample field notes. Sort first, then calculate.
Independent Practice ~10 min
Complete your team charter and data organizer.
Finish the sphere and ‘what it shows’ columns for all six rows. Then draw arrows between at least three rows to show how a change in one sphere caused a change in another.
Write the design problem in one or two sentences: what must be protected, from what, and two criteria and two constraints for the plan.
Closure ~5 min
We have a client, a driving question and organized data. Next phase we investigate how running water moves sediment.
Exit ticket: choose one row of the field notes and explain what it shows about how the fire changed an Earth system.
Teacher notes
Materials: the client letter (a one-page brief from a generic “county soil and water conservation district”), the sample field notes, role cards, chart paper for need-to-knows.
Setup: the field notes are sample data shaped like typical post-fire changes (lower infiltration, more loose sediment, higher turbidity); they are not from a particular fire. Keep the discussion on places and processes; do not dwell on fire danger.
Listen for: “the fire is the only problem”; one-way thinking with no links between spheres; “ash makes soil stronger.”
Support / stretch: give a sphere-sorting card set. Stretch: invite a conservation district or extension staff member to review the criteria by video call.