1.08 Gallery Critique, Visitor Test and Version 2
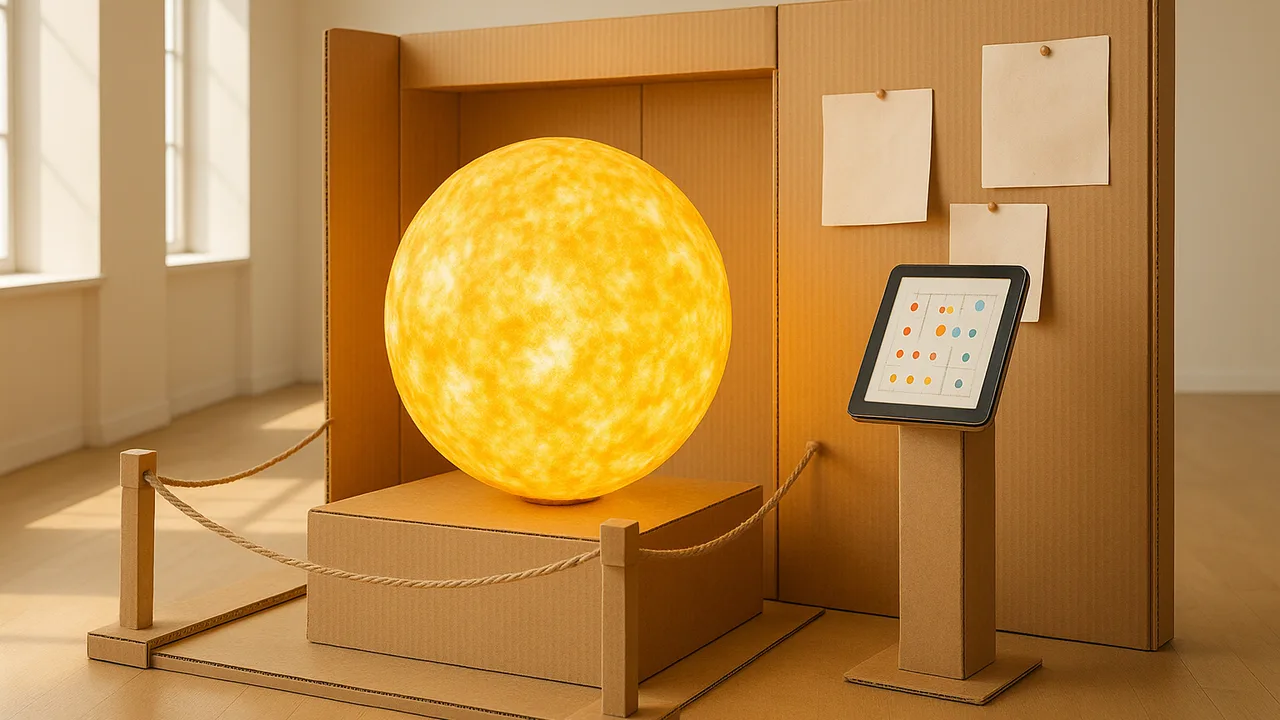
test version 1 against the class criteria with visitor data, give and use peer critique, and build an improved version 2.
- I can describe where the evidence for the Big Bang theory comes from and explain the technology used to collect this evidence, such as telescopes and spectrometers.
- I can use valid and reliable sources, such as scientific investigations, theories, simulations, and peer-reviewed research, to gather evidence about the Big Bang theory.
- I can communicate scientific ideas about how stars produce elements using at least two different formats, such as writing and diagrams.
- I can cite the sources of my scientific information about the life cycle of stars and element formation.
Phase 4: Build
Warm-Up ~5 min
Do Now. Reread your exit ticket from 1.07. Write the one question you most want a test visitor to answer about your station.
A good critique names a specific part of the design and suggests a change that could be tested.
Instruction ~10 min
Gallery critique. Half of each team stays with the prototype; the other half visits. Visitors use the protocol I like… I wonder… What if… on sticky notes. Then the halves swap.
Visitor test. Each team runs its station for ten test visitors (classmates from other teams or invited guests), five minutes each, then asks the same two questions: “Where was the gold in a ring made?” and “What evidence tells scientists the universe began hot and dense?”
| Criterion | Target | Version 1 result | Pass? | Change for version 2 |
|---|---|---|---|---|
| Visitors name where gold was made | 8 of 10 | |||
| Facts accurate and cited | every fact | |||
| Hands-on action | yes | |||
| Scale or math element | yes | |||
| Budget | ≤ 40 points |
Worked example 1: reading the visitor data (sample data). Diego’s team found that 5 of 10 visitors named a neutron-star merger or supernova, 3 said “the Sun” and 2 did not know. Five of ten fails the 8-of-10 target. The sticky notes said the merger panel was at the bottom, behind the string. Version 2 moved it to eye level and added a question flap, “Could the Sun have made this?” On retest, 9 of 10 visitors answered correctly.
Worked example 2: an evidence panel that names its tools. Ava’s team was told, “I wonder how anyone knows this.” They added a strip of three tool icons: a telescope spectrometer (redshift), a microwave satellite (the CMB) and gravitational-wave detectors (the 2017 merger). Each icon carries one sentence and a citation to a space-agency or peer-reviewed source.
Iterate, do not restart. Change one or two things at a time and retest, so you know which change made the difference.
Guided Exercises ~15 min
Use your visitor data and sticky notes.
Independent Practice ~10 min
Build and retest version 2.
Build version 2, retest it with at least five visitors, and record the results in the table. Write three sentences comparing version 1 and version 2 with numbers, and one limitation of your test.
🔎 Mini case study: The space telescope that needed glasses ~8 min
The Hubble Space Telescope was launched in 1990 to collect sharper images and spectra than any ground telescope. Its first images were blurry. Engineers traced the problem to the main mirror, which had been ground very precisely but to a slightly wrong shape: at its edge the error was about one-fiftieth the width of a human hair. Replacing the mirror in orbit was impossible.
Instead, the team designed corrective optics, much like glasses, that would cancel the error. In late 1993 astronauts installed them during a servicing mission, together with a new camera that had the correction built in. The images became sharp, and Hubble went on to help measure the expansion rate of the universe. The failure was found through careful testing of the early data, and the fix was an iteration, not a fresh start.
Think about it: How is the Hubble fix like your version 2? What does this story say about testing a design before and after it is put in front of its users?
Closure ~5 min
Version 2 is tested and ready. Next phase, we finish the station and the cosmic biography and present both to the museum.
Exit ticket: which change from version 1 to version 2 made the biggest difference, and what is your evidence?
How confident are you that you can I can use test data and critique to improve a design against its criteria.
Teacher notes
Materials: version 1 prototypes, sticky notes in two colors, data tables, materials for the rebuild, a timer.
Setup: 12 minutes gallery critique, 15 minutes visitor tests, 15 minutes rebuild, 8 minutes case study. If time is short, run retests at the start of 1.09. Invite staff or older students as test visitors when possible.
Listen for: vague critique; teams changing everything at once; claims that a 10-person test proves the station works for everyone.
Support / stretch: give critique sentence starters. Stretch: calculate the percent improvement from version 1 to version 2 and discuss whether the sample is large enough to trust it.