4.03 Candy Decay: Modeling and Graphing Half-Life
model radioactive decay with a random candy-flip simulation, graph parent atoms remaining against time, read a half-life from my graph, and calculate the fraction remaining after any number of half-lives.
- I can develop and use models to show how fission, fusion, and three types of radioactive decay (alpha, beta, gamma) change the nucleus of an atom.
- I can model and explain the differences in the types of energy (like kinetic energy and electromagnetic radiation) and particles (like alpha and beta particles) released during alpha, beta, and gamma decay, and describe how these decays can change one element into another.
Phase 2: Investigate
Warm-Up ~5 min
Do Now. A sample holds 64 radioactive nuclei. Sketch a graph of nuclei remaining against time if (a) the same number decayed every hour, and (b) the same fraction decayed every hour. Which shape do you expect for real decay?
You have 100 candies, printed side down. Each shake, every candy that lands printed side up “decays” and is moved to a daughter pile. About how many are left after 3 shakes?
Instruction ~10 min
Random for one, predictable for many. No one can say when a particular carbon-14 nucleus will decay; it might be in a second or in 50,000 years. What is fixed is the probability: in any 5,730-year period, each carbon-14 nucleus has a 50% chance of decaying. With trillions of nuclei, that probability becomes a very reliable pattern. The half-life (t1/2) is the time for half of the nuclei in a sample to decay. It does not depend on temperature, pressure or chemical form, which is exactly why it works as a clock.
The math. After n half-lives, the fraction of the original parent nuclei remaining is (1/2)n, where n = t ÷ t1/2. So the amount remaining is N = N0 × (1/2)t / t1/2. After 1 half-life, 1/2 remains; after 2, 1/4; after 3, 1/8; after 10, about 1/1000. The nuclei that decayed become daughter nuclei of a different element; they do not vanish.
Worked example 1: whole half-lives. Rosa’s hospital chart lists phosphorus-32, half-life 14.3 days. A 64 mg sample is stored for 57.2 days. n = 57.2 ÷ 14.3 = 4 half-lives. Remaining: 64 → 32 → 16 → 8 → 4 mg, or 64 × (1/2)4 = 64 ÷ 16 = 4.0 mg. The other 60 mg became sulfur-32 by beta-minus decay.
Worked example 2: a part of a half-life. Malik asked whether a smoke detector’s americium-241 (half-life 432 years) runs down before the detector is replaced after about 10 years. n = 10 ÷ 432 = 0.0231. Fraction remaining = (1/2)0.0231 = 0.984 (use the yx key). About 98.4% of the americium is still there: the source easily outlasts the detector. Detectors are replaced because their electronics and sensing chamber age, not because the source runs out.
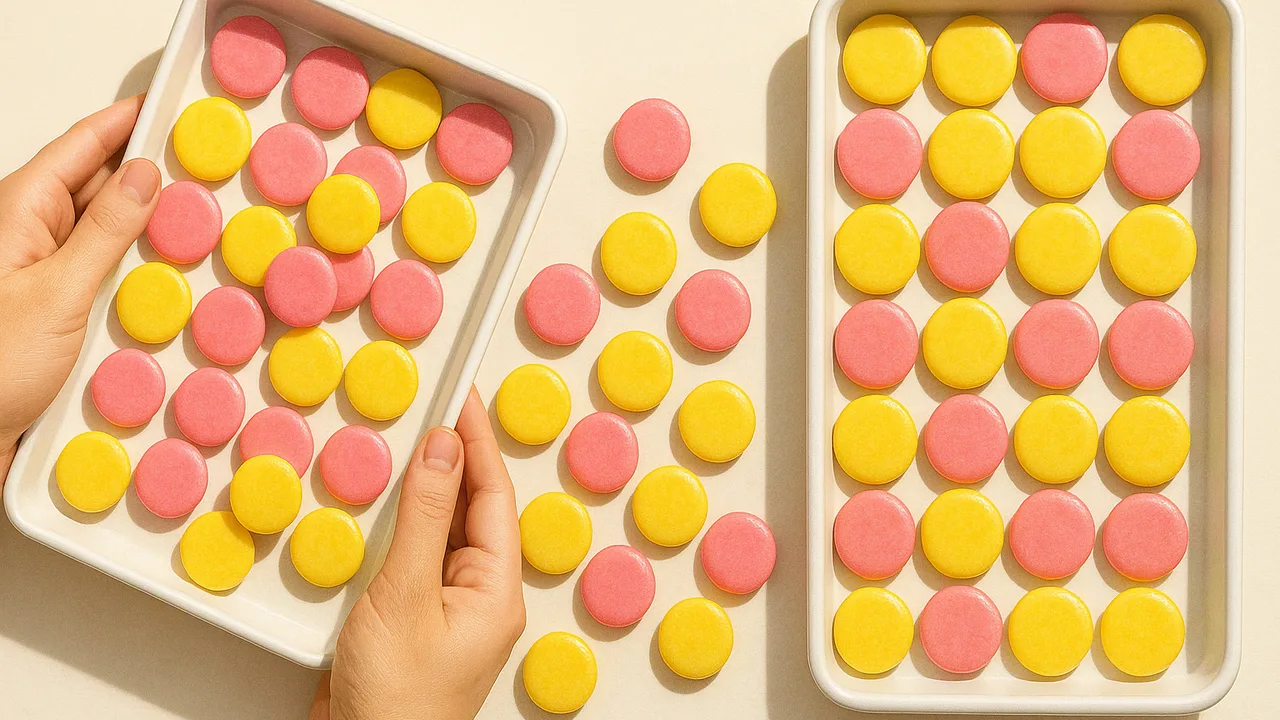
Lab: candy decay. Each team gets 100 small candies printed on one side, a lidded container and a tray. (1) Start with all candies printed side down; this is time zero, all parent. (2) Close the lid, shake gently for 3 seconds, and pour onto the tray. (3) Move every candy showing the print to the daughter cup; count both piles and record. (4) Return only the parent candies to the container. Each shake stands for one half-life of a made-up isotope we will call “exhibitium,” with t1/2 = 1,000 years. (5) Repeat until fewer than 3 parent candies remain. (6) Add your counts to the class table and graph parents and daughters against time on the same axes.
| Time (years) | 0 | 1,000 | 2,000 | 3,000 | 4,000 | 5,000 | 6,000 |
|---|---|---|---|---|---|---|---|
| Parent remaining (sample team) | 100 | 52 | 27 | 13 | 7 | 3 | 2 |
| Daughter (sample team) | 0 | 48 | 73 | 87 | 93 | 97 | 98 |
| Ideal parent | 100 | 50 | 25 | 12.5 | 6.25 | 3.1 | 1.6 |
| Your team / class average | 100 |
Reading the graph. The parent curve falls steeply at first and then flattens; it never quite reaches zero. The daughter curve is its mirror image, and the two cross at exactly one half-life, when parent = daughter. To read a half-life from any decay graph, find the time when the parent has fallen to half its starting value; then check that it takes the same time again to halve once more. The ratio of daughter to parent climbs from 0 to 1 after one half-life, 3 after two and 7 after three: that ratio is the clock you will use next lesson.
How good is the model? Like real nuclei, each candy has a fixed chance per shake and no memory of past shakes. Unlike real nuclei, the chance is about 1/2 per step and we have only 100 “atoms,” so the counts scatter. A real sample has around 1020 nuclei, so its curve is smooth.
Reading. OpenStax Chemistry 2e, section 21.3 (radioactive decay: half-lives), CC BY 4.0.
Guided Exercises ~15 min
Use your graph and a calculator. Show n for every half-life question.
Independent Practice ~10 min
Finish your graph and lab write-up in the Exhibit Notebook.
Plot your team's parent and daughter counts and the class average on the same axes, with the ideal curve. Read the half-life from your class-average curve and compare it with 1,000 years. Give one reason your team's curve differs from the ideal.
In each candy “decay,” what would really be happening inside an exhibitium nucleus if it decayed by alpha emission? By beta-minus emission? Describe the change in protons and neutrons and what leaves the nucleus each time.
Closure ~5 min
Half-life turns randomness into a reliable clock. Next class, we read that clock in rocks, bones and crystals.
Exit ticket: a sample of exhibitium has 1/16 of its parent atoms left. How many half-lives and how many years have passed? Show the halvings.
Teacher notes
Materials (per team): 100 small candies printed on one side (or 100 two-colored counters or pennies for students with allergies or by preference), a lidded plastic container, a tray, a small cup for daughters, graph paper or a spreadsheet, calculators with a power key.
Setup: pre-count candies into bags. Put the class table on the board and have each team add each row as they finish. Discard all candy at the end of the period.
Answers: exit ticket 4 half-lives, 4,000 years. I-131: (1/2)1.5 = 0.354.
Listen for: “after two half-lives it is all gone”; “half-life is half the total lifetime”; a straight-line sketch for decay.
Support / stretch: provide a pre-labeled axis and a halving ladder (100, 50, 25…). Stretch: model an isotope with a 1-in-6 chance per step by rolling dice and removing sixes; predict and then measure how many rolls make one half-life (about 3.8, since (5/6)3.8 ≈ 0.5).