verify historical claims against reliable sources, distinguish invention from innovation, and prototype the structure of a presentation as a physical timeline.
Instruction
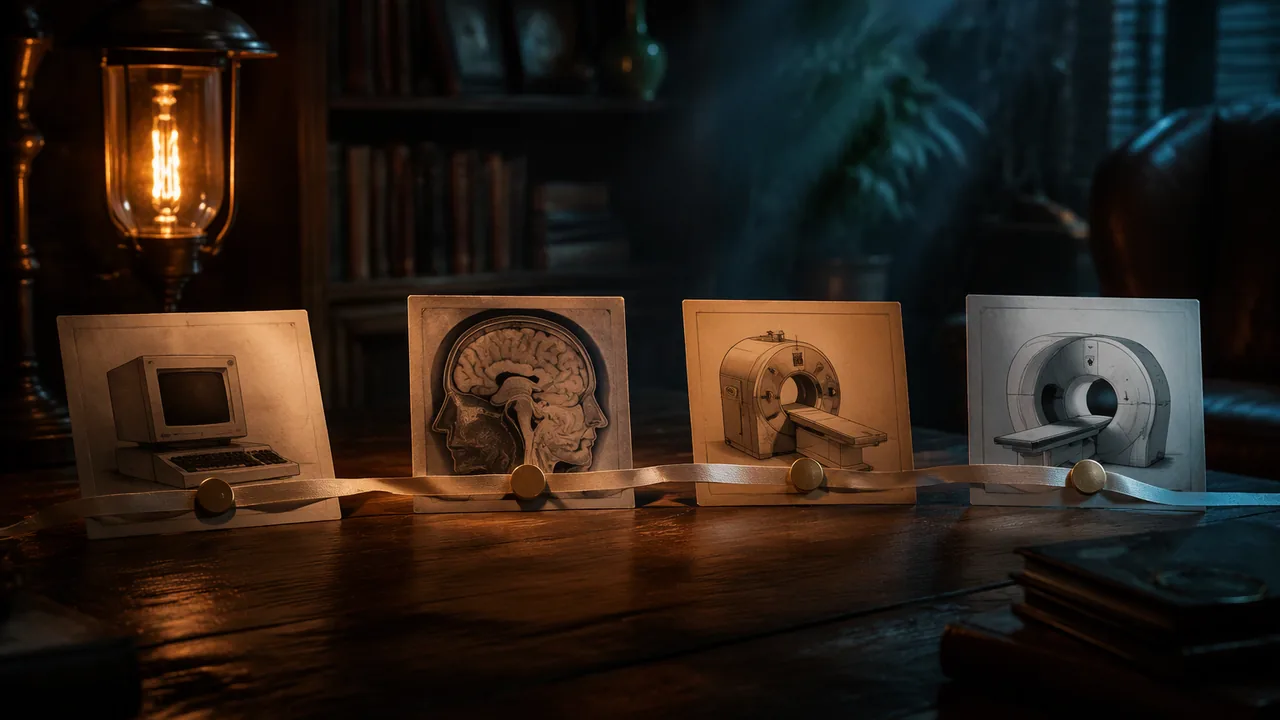
Before you design a single slide, you will build your presentation as an object on a table. Physical prototyping lets you move ideas around faster than any software, and it forces you to decide what each card is for.
Invention and innovation. The approved course asks you to understand the difference. An invention is a new device, method or idea: the first working version. An innovation is an invention (or a combination of them) put into practice so that it changes what people do. The perceptron was an invention; decades of work on data, computing power and training methods were needed before neural networks became an innovation in medical imaging. Innovations often combine old inventions in a new way. The IDx-DR system combined retinal cameras (long in use), deep-learning methods and a new regulatory pathway and clinical workflow. Your presentation should show both the invention and the path to innovation.
A Missouri example. Positron emission tomography (PET), a way of imaging chemical activity inside the body, is not AI, but its story shows the same pattern, and it began in St. Louis. Washington University School of Medicine credits 1970s work at its Mallinckrodt Institute of Radiology by the physicist Michel Ter-Pogossian, the nuclear chemist Michael Phelps and the computer pioneer Jerome Cox with the first PET machine; the first scholarly articles on PET appeared in 1975. Phelps later moved to UCLA, where he was involved in creating the first commercial PET systems. The St. Louis scanner was the invention; commercial systems that carried it into hospitals everywhere were part of the innovation. (Sources: Washington University McKelvey School of Engineering, “Pushing the boundaries of the visible world”, 2022; Barnes-Jewish Hospital Curiosus, “Learning to See Inside the Body”, 2021; both retrieved November 10, 2026. Notice that neither gives one exact year for the first machine, so a careful card says “early 1970s”.)
Verify every card. Each card will carry one event, a date and a source. Use this test. Is the source close to the event (the organization’s own publication, a government record, the original paper) or a reliable secondary source that cites it? Can you find the same date in a second independent reliable source? If two sources disagree, write both and note the disagreement, or use a broader date (“early 1970s”). Never fill a gap with a guess. Useful sources: FDA decision summaries and the FDA AI-enabled device list; NIH and National Library of Medicine pages; the original research paper’s abstract; a university’s own history page. Wikipedia is a place to find leads, not a source to cite.
Card design. Each card has a short headline (under eight words), a date, one line on why it matters and the source in small type. Use one color for inventions and another for innovations, so the pattern of your story is visible before anyone reads a word. If you use to-scale spacing, measure it: for example, if 70 years (1950-2020) runs along a 140 cm string, each decade is 20 cm.
From timeline to storyboard. A presentation is not a timeline read aloud. Once the cards are on the string, step back and ask: where is the turning point? What does the audience need to know before it? Which two or three cards are the heart of the story? Then lay out a storyboard of slides beneath the string: one slide per idea, not one per event. Some events will merge; some will drop.
Photograph the process. Take a photo of your first arrangement and your final one. The change between them is evidence of your creative decisions, and you will use it in your statement.
📖 Read for this lesson
The reading opens over the lesson; close it to come back to exactly where you were. The checks below draw on it.
Studio: String, clips and verified cards
Question. How can a physical timeline of verified events reveal the turning point in an AI innovation’s story and become the structure of a presentation?
Materials
- 20 index cards, or paper cut to card size, in two colors or marked with two marker colors (inventions and innovations)
- About 1.5 m of string or yarn and 20 clothes pegs or binder clips
- Fine-tip markers and a meter stick or tape measure
- Scissors and glue stick
- A phone, tablet or any camera for photographs
- Source log sheet (paper or a document on your computer)
- Use round-tip scissors and close them when not cutting; no craft knives are needed.
- Stretch the string at table height, not across walkways, so no one trips.
- Glue sticks only; they are non-toxic, but wash hands before eating.
Procedure
- Choose your innovation from the checked options in Lesson 2.5’s reading, or choose your own that has at least one federal or peer-reviewed source.
- Research 10-14 events: at least three earlier inventions it grew from, the step that put it into practice and at least one event after adoption. Log each source.
- Check each date in a second independent reliable source. Mark any date you cannot confirm as approximate or drop it.
- Write each card: headline, date, why it matters, short source. Use the invention color or the innovation color.
- Peg the cards on the string to scale. Photograph the first arrangement.
- Find the turning point. Rearrange, merge or drop cards to make the story clear, then lay out a slide storyboard beneath the string. Photograph the final arrangement.
Data
| Event | Date | Source 1 | Source 2 (confirms?) | Invention or innovation | Keep, merge or drop |
|---|---|---|---|---|---|
Analysis
- Which card is your turning point, and what evidence convinced you?
- Which claim was hardest to verify, and what did you do about it?
- Compare your first and final photographs. Describe two changes and the reason for each.
- Where does your story show the difference between invention and innovation most clearly?
If you cannot do this studio in person: Build the same timeline as a table in a word processor or on paper at home, and arrange paper strips on a kitchen table or floor; photograph the arrangement with any camera, or sketch it if no camera is available.
Formative check
Work through these before moving on. They are not graded — they tell you whether the standard below has landed yet.
Two sources give different years for the same event. What should you do?
The perceptron (late 1950s) was an invention; the use of deep neural networks to screen retinal images in clinics is an innovation.
If 70 years run along a 140 cm string, each decade takes cm.
How confident are you that you can verify historical claims and prototype my presentation’s structure as a physical timeline?
Practice
Work these on paper or in your notebook, then open Check your answer. Aim for all of Fluency and Application; try at least one Challenge.
Printable version: this unit’s practice workbook (PDF)
Fluency
Build speed and accuracy with the core skill.
- Define invention and innovation, and classify: (a) the perceptron in the late 1950s; (b) deep neural networks screening retinal images in clinics.
Check your answer
Answer: An invention is a new device, method or idea, the first working version. An innovation is an invention, or a combination of them, put into practice so it changes what people do. (a) invention; (b) innovation.Decades of work on data, computing power and training methods were needed before neural networks became an innovation in medical imaging. - List the four parts of an event card and the length limit for the headline.
Check your answer
Answer: A short headline (under eight words), a date, one line on why it matters, and the source in small type.Cards also use one color for inventions and another for innovations. - If 70 years run along a 140 cm string, how many cm is one year? How far from the start is an event 25 years after the start?
Check your answer
Answer: 2 cm per year; 50 cm.140 / 70 = 2; 25 x 2 = 50.
Application
Use the skill in context. Show your reasoning.
- The two sources for PET do not give one exact year for the first machine, but the first scholarly articles appeared in 1975. Write the date line for a card about the first St. Louis PET machine, and explain your choice.
Check your answer
Answer: ‘Early 1970s’ for the first machine (with 1975 as the date of the first scholarly articles, if a second card is wanted).If sources do not agree or do not give an exact date, use a broader date and never fill the gap with a guess. - In the PET story, which part is the invention and which part is the innovation?
Check your answer
Answer: Invention: the first PET machine built at Washington University’s Mallinckrodt Institute of Radiology in St. Louis (Ter-Pogossian, Phelps and Cox). Innovation: the commercial PET systems, which Phelps helped create after moving to UCLA, that carried PET into hospitals everywhere.The invention is the first working version; the innovation is putting it into practice widely. - Rank these sources for an event card from strongest to weakest and say how you would use the weakest: a Wikipedia article; an FDA decision summary; a university’s own history page that cites the original paper.
Check your answer
Answer: FDA decision summary (primary, government record); the university history page (close to the event, cites the original); Wikipedia (weakest), used only to find leads, not cited.The verification test asks whether the source is close to the event or a reliable secondary source that cites it, and whether a second independent source confirms the date. - IDx-DR is described as combining three things. Name them, and explain why this makes it an innovation rather than a single invention.
Check your answer
Answer: Retinal cameras (long in use), deep-learning methods, and a new regulatory pathway and clinical workflow. It combined existing inventions in a new way that changed practice, which is what an innovation does.Innovations often combine old inventions in a new way. - Your string holds 14 event cards, but your storyboard should have one slide per idea, not one per event. Describe two decisions you would make when turning the string into slides.
Check your answer
Answer: Model: Find the turning point and decide what the audience must know before it. Merge related events into one slide (for example, three earlier inventions on one ‘roots’ slide) and drop events that do not serve the story, keeping the two or three heart cards as their own slides.A presentation is not a timeline read aloud. Photographing first and final arrangements records these decisions.
Review
Keep earlier skills sharp.
- Review 2.1: A card says ‘ELIZA, 1966’. Name the person and institution the lesson gives, and one line on why it matters.
Check your answer
Answer: Joseph Weizenbaum at MIT. Why it matters: it imitated a psychotherapist by rephrasing users’ words, and Weizenbaum was disturbed by how readily people confided in it.A good ‘why it matters’ line is one sentence, not a summary of everything.
Verified Event Cards: A Checked Worked Set, the Two-Source Test and a Date Conflict
SLS original worked set; dates from Crossref journal records (doi 10.1037/h0042519, 10.1038/323533a0, 10.1001/jama.2016.17216, 10.1038/s41586-021-03819-2), NeurIPS proceedings (NIPS 2012), FDA De Novo summary and database entry DEN180001, and the FDA AI-Enabled Medical Devices page; retrieved Sept. 26, 2026; Missouri PET history from the Washington University McKelvey School of Engineering news page (Nov. 28, 2022) and Barnes-Jewish Hospital Curiosus (Aug. 2021), retrieved Nov. 10, 2026 · SLS original, citing public bibliographic records and public-domain U.S. government documents
Why this reading. The lab asks you to research 10–14 events, verify each date in a second source, and lay the cards on a scale string. You choose your own innovation; below is a checked worked example, the exact verification test, and how to handle a date that two sources give differently. The card set is an SLS original built from the sources named on each card, all looked up on 26 September 2026. Your own set needs 10 to 14 cards and your own sources; choose any innovation for which you can find at least four sources including one federal source.
The verification test, as steps
- Get as close as you can to the event. The best source is the thing itself: the paper, the government decision record, the organization’s own publication. A reliable secondary source that cites it is next. A general encyclopedia is a place to find leads, not to cite.
- Find the date in a second, independent source. “Independent” means it did not copy the first. A journal’s own web page and a bibliographic database entry for the same paper count as two records but not as two witnesses; a government summary plus that government’s separate database entry is closer to two.
- If they disagree, write both dates with their sources, or use a wider date such as “early 1970s,” and note the disagreement. Never fill a gap with a guess.
- Name what the date is the date of. An event can have several dates: submitted, decided, published, first used.
A worked example: autonomous screening for diabetic retinopathy (seven cards)
| # | Headline (under 8 words) | Date | Type | Source on the card | Position on a 140 cm string, 1958–2018 |
|---|---|---|---|---|---|
| 1 | Perceptron: learning machine described | 1958 | Invention | Rosenblatt, Psychological Review 65(6), 386–408 (doi 10.1037/h0042519) | 0.0 cm |
| 2 | Backpropagation trains multilayer networks | Oct. 1986 | Invention | Rumelhart, Hinton, Williams, Nature 323, 533–536 (doi 10.1038/323533a0) | 65.3 cm |
| 3 | Deep network wins image classification | 2012 | Invention (method) | Krizhevsky, Sutskever, Hinton, Advances in Neural Information Processing Systems 25 (NIPS 2012) | 126.0 cm |
| 4 | Deep learning tested on retinal photographs | Dec. 13, 2016 | Research step | Gulshan et al., JAMA 316(22), 2402 ff. (doi 10.1001/jama.2016.17216) | 135.3 cm |
| 5 | IDx-DR submitted to FDA (De Novo) | Jan. 12, 2018 | Innovation step | FDA De Novo summary DEN180001, “Date of De Novo”; FDA De Novo database, “Date Received” | 140.0 cm |
| 6 | FDA grants first autonomous screening device | Apr. 11, 2018 | Innovation (turning point) | FDA De Novo database, DEN180001, “Decision Date 04/11/2018” | 140.0 cm |
| 7 | New rule: retinal diagnostic software, class II | 2018 | Innovation step | DEN180001 summary: new regulation 21 CFR 886.1100, product code PIB | 140.0 cm |
Where the dates came from. Cards 1, 2 and 4: the journals’ own bibliographic records as deposited with Crossref (the DOI registry), which give the journal, volume, pages and the date the version of record was issued. Card 3: the NeurIPS proceedings page for the paper, which names the volume as NIPS 2012. Cards 5, 6 and 7: the FDA’s De Novo decision summary (DEN180001), which gives the request date, and the FDA’s De Novo database entry, which gives “Date Received” and “Decision Date.” For cards 1 to 4, a second independent source (for example the journal’s own page, or a library catalog) is the step you would still do before using them in a presentation.
Invention or innovation? Cards 1 to 3 are inventions: new methods, first working versions. Card 4 is a research test of the method on a medical task. Cards 5 to 7 are the innovation: a regulator’s decision, a new device class and a new rule, which let the method be used in a clinic. The gap from card 1 to card 6 is 60 years; on the 140 cm string that is 2.33 cm per year, and the FDA decision sits at the far end (140 cm). The turning point of this story is not the invention, it is the regulator’s decision, and the seven cards show that in one glance.
A date conflict, worked
The lesson lists AlphaFold 2 under 2020. The Nature paper describing it, “Highly accurate protein structure prediction with AlphaFold,” volume 596, pages 583–589, was issued on 15 July 2021 (Crossref record, doi 10.1038/s41586-021-03819-2; the paper is open access under CC BY 4.0). Neither date is wrong: they are dates of different events (the result being announced and the paper being published). A good card says which: “Result announced, 2020” or “Paper published, July 2021.” Verify the earlier date in a source of your own before you use it.
A Missouri example of invention and innovation: PET imaging
Positron emission tomography (PET) is not AI, but it is a clean example of the difference between an invention and an innovation, and it began in St. Louis. Washington University’s McKelvey School of Engineering credits 1970s research by Michel Ter-Pogossian and Michael E. Phelps at the university’s Mallinckrodt Institute of Radiology with leading to “the development of positron emission tomography (PET) and the first PET scanner” (“Pushing the boundaries of the visible world,” November 28, 2022). A 2021 article in Barnes-Jewish Hospital’s Curiosus magazine, “Learning to See Inside the Body,” names the first team as Ter-Pogossian, a physicist and professor of radiology; Phelps, a nuclear chemist; and Jerome Cox, founder of the medical school’s Biomedical Computer Laboratory, and says Phelps and other scientists published the first scholarly articles on PET in 1975. The same article says Phelps later moved to UCLA, where he was involved in creating the first commercial PET systems.
Read it as cards. The scanner built at the Mallinckrodt Institute is the invention. The first commercial systems, which carried the method into hospitals beyond the one where it was built, are a step toward innovation. Notice the date problem. Neither page gives a single year for the first machine; the one firm date is the 1975 publication. A careful card says “First PET scanner built, Mallinckrodt Institute, St. Louis, early 1970s” and a second card says “First scholarly articles on PET, 1975,” each with its source. (Both pages retrieved 10 November 2026.)
Card design and the source log
Each card has a headline of under eight words, a date, one line on why it matters, and the source in small type. Use one color for inventions and another for innovations. For the source log, keep one row per card with these columns: card number, event, date, first source (with page or identifier), second source, status (confirmed, conflict, or dropped), and what the date is the date of.
One more check, on lists of “AI devices”
The FDA publishes a list of AI-enabled medical devices. Its own page says the list contains devices that have met the FDA’s applicable premarket requirements, that devices are identified “primarily based on the use of AI-related terms” in their summaries, and that “the list is not a comprehensive resource of AI-enabled medical devices.” At retrieval on 26 September 2026 the most recent final decision shown was dated 06/29/2026. So an absence from the list is not proof that a device does not use AI, and a device’s presence is not a claim of how well it works.
Sources: FDA De Novo database, DEN180001 (IDx-DR) (accessdata.fda.gov); FDA De Novo decision summary DEN180001 (accessdata.fda.gov); FDA, List of Artificial Intelligence-Enabled Medical Devices (fda.gov); Rosenblatt (1958), The perceptron, Psychological Review 65(6) (doi.org); Rumelhart, Hinton, Williams (1986), Learning representations by back-propagating errors, Nature 323 (doi.org); Gulshan et al. (2016), JAMA 316(22) (doi.org); Jumper et al. (2021), Highly accurate protein structure prediction with AlphaFold, Nature 596 (CC BY 4.0) (doi.org); Washington University McKelvey School of Engineering, “Pushing the boundaries of the visible world” (Nov. 28, 2022) (engineering.washu.edu); Barnes-Jewish Hospital, Curiosus, “Learning to See Inside the Body” (Aug. 2021) (barnesjewish.org)